
Article's Content
Article's Content
There are three acronyms you need to know before you launch a new product: TAM, SAM, SOM.
They’re your roadmap to understanding the market landscape. Dive into who your audience is, their value perception, and the size of your opportunity – before you even launch.
We’re breaking down each of these: Total Addressable Market (TAM), Serviceable Addressable Market (SAM), and Serviceable Obtainable Market (SOM).
In this comprehensive guide, we will explore the utmost importance of these metrics, walk you through how to calculate them with examples, and give you the tools to do it yourself.
What Is TAM, SAM, and SOM?
Before we delve into the details, let’s define the concepts of TAM, SAM, and SOM.
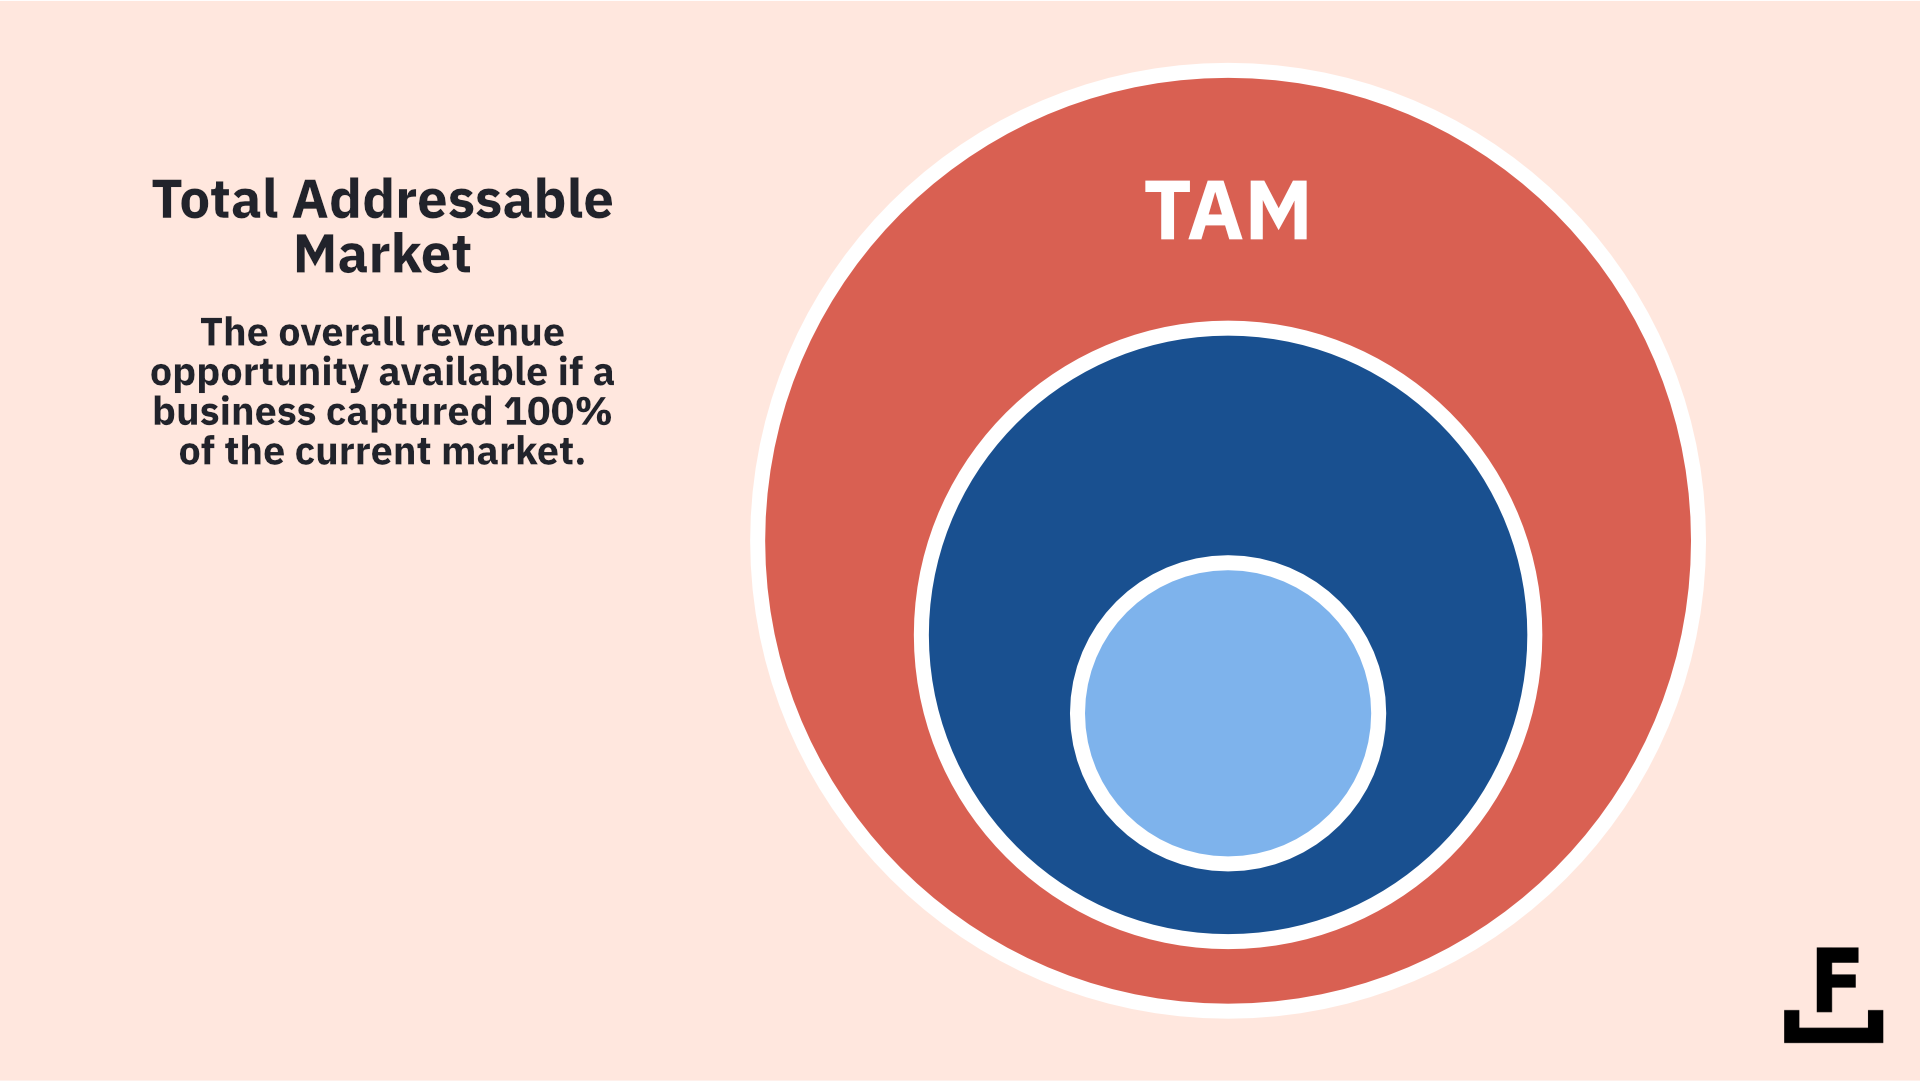
Total Addressable Market (TAM)
TAM represents the total revenue opportunity available for a product or service in a specific market or industry. It is the maximum revenue a company could generate if it held 100% market share.
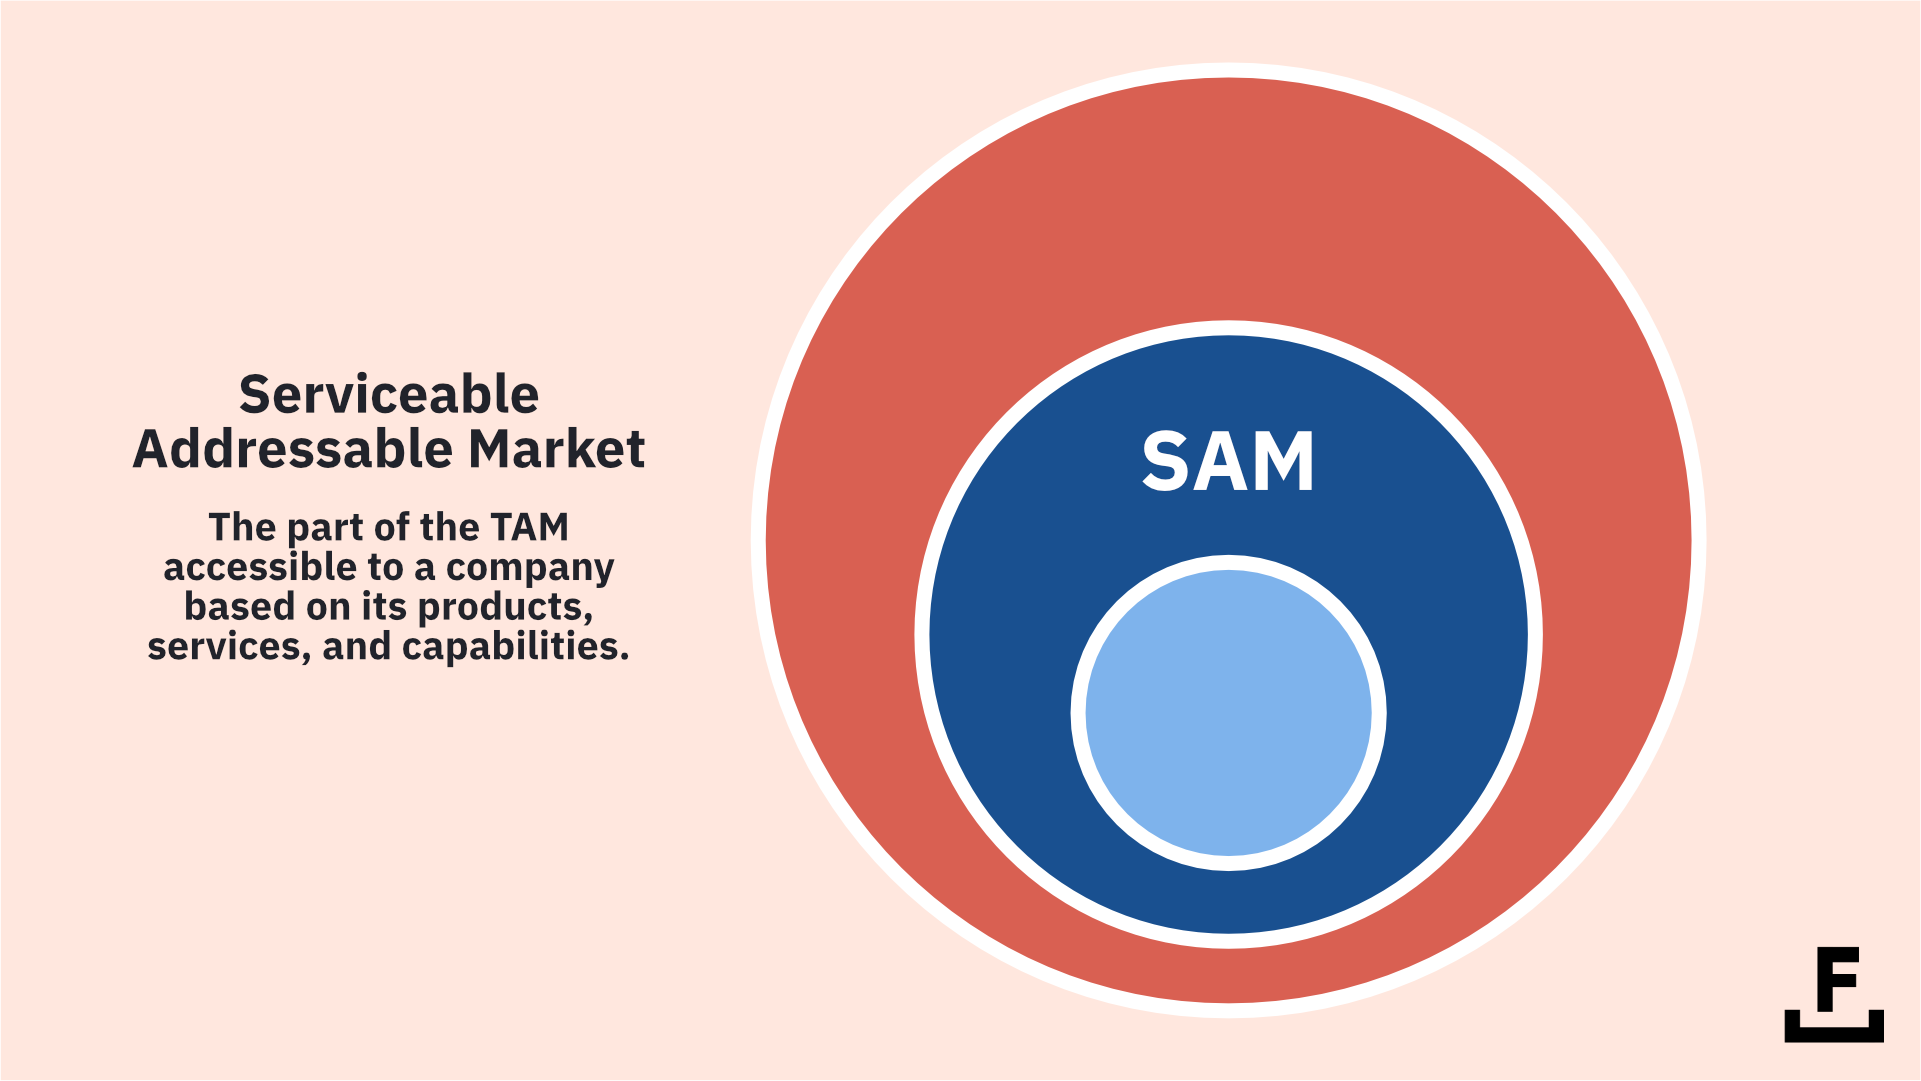
Serviceable Addressable Market (SAM)
SAM is the portion of TAM that a company can realistically serve with its current product offerings, distribution channels, and target market. Considering the company’s limitations and competition, it is a more focused estimate of the potential market size.
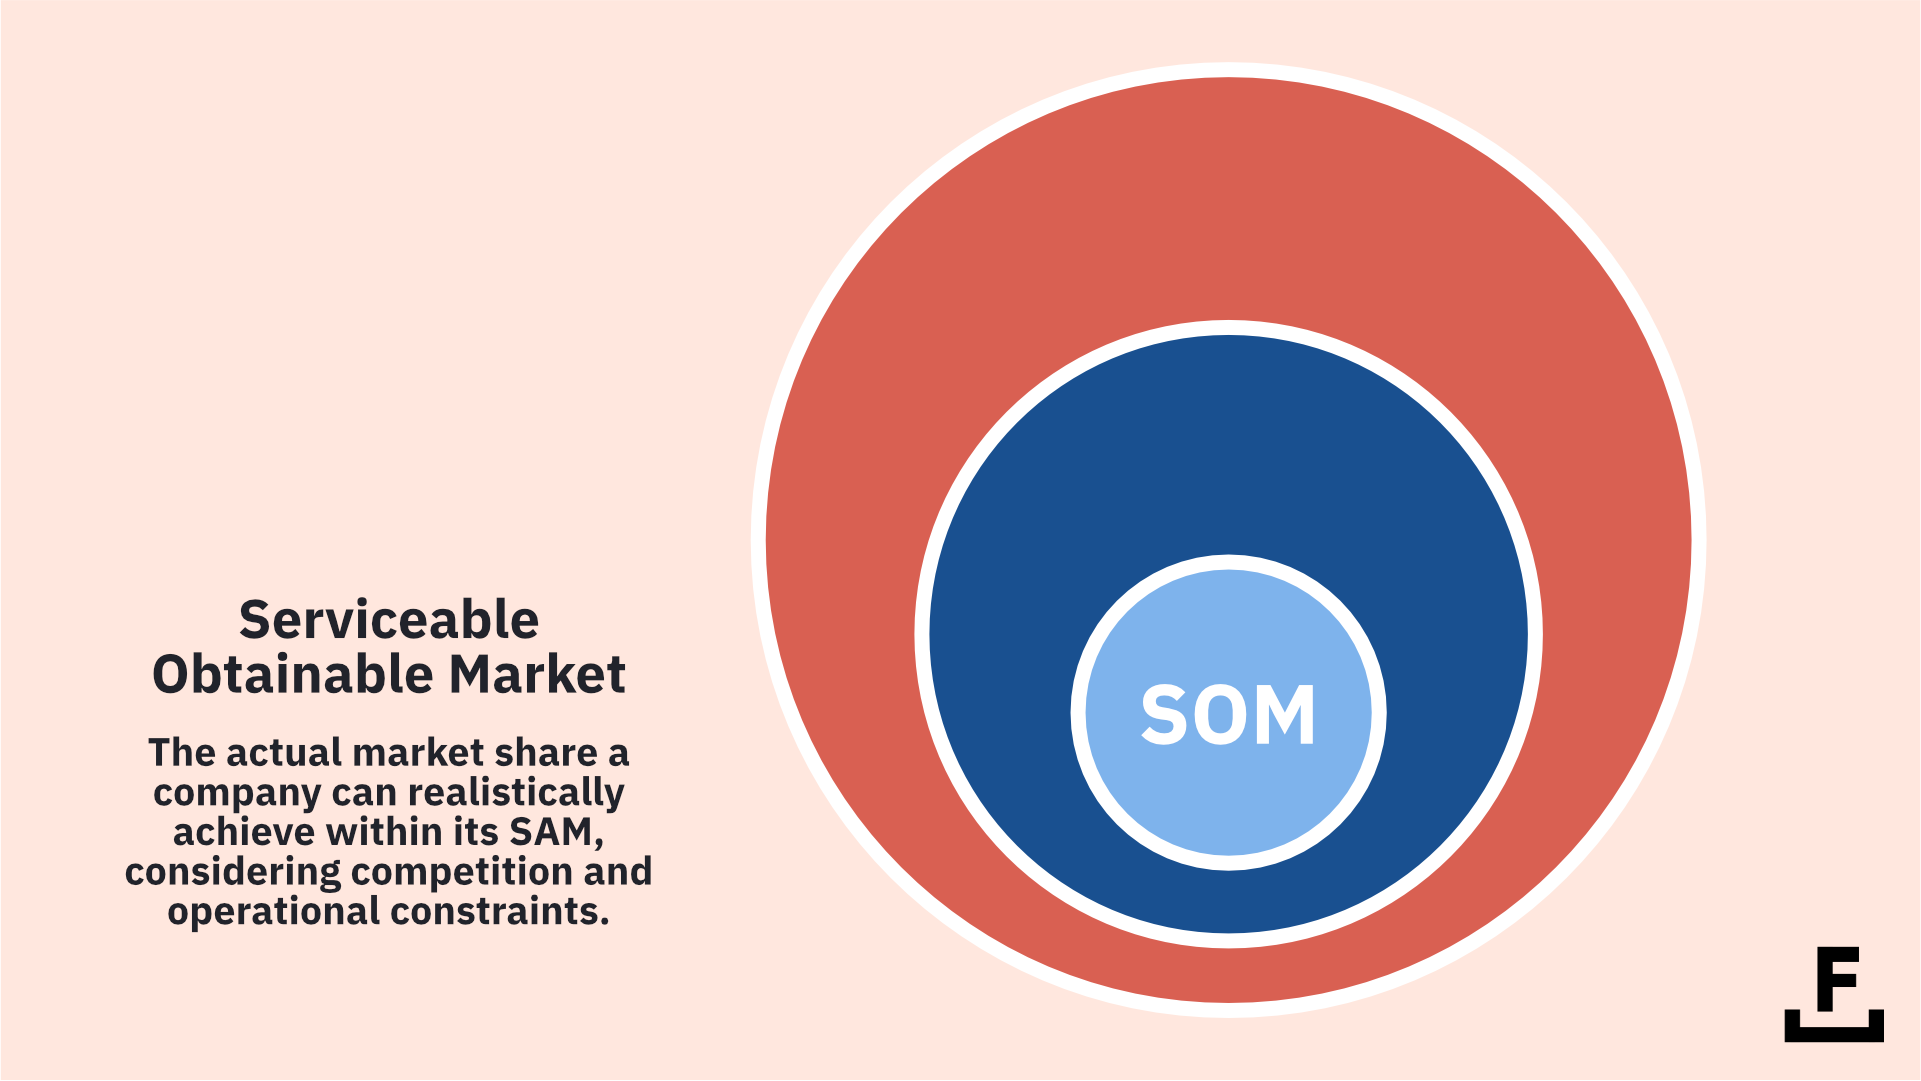
Serviceable Obtainable Market (SOM)
SOM, also known as the Serviceable Obtainable Market, is the market share a company can realistically achieve within its SAM in a specific timeframe. It is the most conservative estimate of the potential market size and helps businesses set realistic revenue targets.
Why are TAM, SAM, and SOM Important?
There are several reasons why calculating TAM, SAM, and SOM is crucial for businesses:
- Market potential assessment: These metrics help businesses estimate the potential market size for their products or services, allowing them to make better strategic decisions and allocate resources more efficiently.
- Investment decisions: Investors and venture capitalists often use TAM, SAM, and SOM to evaluate the potential of a startup or a new project before making investment decisions.
- Product development and market entry strategies: Knowing the market size can help businesses decide whether to develop new products, enter new markets, or diversify their offerings.
- Competitive analysis: These metrics can help businesses understand their competitive position in the market and identify areas where they can improve or expand.
- Sales and marketing planning: By understanding the size of their target market, businesses can develop more effective sales and marketing strategies and set realistic revenue targets.
Calculation Methods
There are two primary approaches to calculating TAM, SAM, and SOM: top-down and bottom-up. Each method has its advantages and limitations, and it’s smart to use both approaches for a more accurate and comprehensive market size estimation.
Top-Down Approach
The top-down approach begins with a broad market overview and narrows to the target market segments. This method typically involves using industry reports, market research data, and other secondary sources to estimate the total market size and then applying various assumptions and filters to determine the SAM and SOM.
Advantages of the Top-Down Approach
- Provides a broad market perspective
- Is relatively quick and easy to execute
- Is useful for initial market assessment and high-level strategic planning
Limitations of the Top-Down Approach
- May rely heavily on secondary data, which can be outdated or inaccurate
- Can be overly optimistic, as it may not consider specific market limitations or competitive dynamics
- Can lead to an overestimation of the potential market size
Bottom-Up Approach
The bottom-up approach starts with a detailed analysis of the company’s target market segments and builds up to estimate the TAM, SAM, and SOM. This method involves collecting primary data, such as customer surveys, interviews, and sales data, and using this information to estimate the potential market size.
Advantages of the Bottom-Up Approach
- Provides a more accurate and detailed market size estimation
- Considers specific market dynamics and competitive factors
- Is more reliable for setting realistic revenue targets and sales forecasts
Limitations of the Bottom-Up Approach
- Can be time-consuming and resource-intensive
- Requires access to reliable primary data sources
- May still require some assumptions and estimations
Total Addressable Market (TAM)
Calculating TAM involves estimating the total revenue potential for a product or service in a specific market or industry. This metric is crucial for understanding the market’s overall potential and stability.
What Is TAM, SAM, SOM For Foundation?
At Foundation, we don’t guess at market size…
We build it from the ground up the same way we’ve always done our best work.
Our TAM is every B2B company on earth that needs to be found by buyers and by the machines those buyers now ask first. That’s enormous, and honestly it’s not the number that matters. Our SAM is tighter. It’s the brands who’ve realized that ranking on Google was step one, and that getting cited inside AI answers is the game now.
We’ve been early to these shifts before. Reddit for B2B back in 2018. GEO and AEO eighteen months ahead of the pack. So our SAM is the set of companies ready to move where the attention is actually going. Then there’s SOM.
That’s the slice we can win this year with the team, the IP, and the Share of Model research we already own. We size it bottom-up, account by account, because a real revenue target beats a pretty TAM slide every time. TAM tells you the dream is big enough.
SOM tells you where to point the cannon on Monday morning.
How Do You Calculate TAM?
Since you can calculate your TAM using either the top-down or bottom-up approach discussed above, let’s look at how those approaches vary in the specific case of the TAM and then use an example to clarify things.
If you’re using a top-down approach, you’d start with using broader market data to estimate the market size and then refine the TAM estimate based on the company’s target market segments. While this approach requires access to accurate, market-level data, the data collection is the hard part. It requires some capital but not too much hard work on your part.
For a bottom-up approach, you’d start with doing the data collection yourself to estimate the potential market size for the company’s target market segments. You can aggregate the estimates for each segment to determine the overall TAM. As you can probably guess, this method is much more labor intensive, but in the absence of accurate market data, it might be your only good option.
Serviceable Addressable Market (SAM)
Calculating SAM involves estimating the portion of your TAM that your company’s existing products and distribution channels can address. This metric is essential for understanding the maximum market value of your company based on its target market.
How Do You Calculate SAM?
To calculate SAM, you need to identify the specific market segments relevant to your product or service and estimate the potential market size for each segment. This can be done using either the top-down or bottom-up approach:
Top-down approach: Start with the TAM estimate and apply various filters and assumptions to refine the SAM estimate based on the company’s specific target market segments.
Bottom-up approach: Similar to the TAM approach, you’d collect primary data, such as customer surveys, interviews, and sales data, and use this information to estimate the potential market size for each target market segment. Then, you could add the estimates for each segment together to determine the overall SAM.
Serviceable Obtainable Market (SOM)
Calculating SOM involves generating a reasonable estimate of the portion of your SAM that your company can achieve in a certain period. This metric helps businesses set realistic revenue targets and better understand their competitive position in the market.
How Do You Calculate SOM?
This is where you need to be both realistic and strategic and consider your company’s current capabilities, competitive positioning, and market dynamics. It can be a bit trickier to calculate SOM than the other two calculations, and a simple bottom-up or top-down approach won’t necessarily serve you well every time. However, these five tips can help set you up for success:
- Understand Your Competitive Edge: Start by analyzing what makes your product or service stand out. Are you offering better prices, superior quality, or innovative features? This will help determine your appeal in the target market.
- Market Share Analysis: Look at your current market share in the SAM and assess how much you can grow based on factors like marketing efforts, product development, and sales strategies.
- Consider Market Growth: Factor in how the market is evolving. If the market is growing, you might capture a larger share without taking customers from competitors.
- Assess Limitations and Barriers: Identify any barriers to growth, such as limited production capacity, budget constraints, or strong competition.
- Set Realistic Goals: Based on these analyses, set a realistic percentage of the SAM you believe your company can obtain. This should be a specific, time-bound target.
TAM, SAM, and SOM Calculation Examples
All of that was pretty abstract and complicated, so let’s walk through how to calculate each of these numbers with both the top-down and the bottom-up methods, using examples to ground us along the way. We’ll be using the example of an app for grocery shopping in the United States here.
Top-Down Calculation Examples
First, let’s start with the top-down method. In general, this will involve collecting broader market data and narrowing it down from there, but as you’ll see, we’ll be able to build off past work as we work down the TAM, SAM, and SOM.
Top-Down TAM Calculation Example
- Identify the Industry: Start by defining the broader industry relevant to your product. In this case, it’s the online grocery shopping industry in the United States.
- Research Industry Revenue: Gather data on the total revenue of the online grocery shopping industry. This information can typically be found in industry reports, market research studies, or financial news articles.
- Estimate the Total Market Revenue: In this example, we’ll assume that you’ve found the total revenue for the online grocery industry in the US is $100 billion.
- Determine the Relevant Market Segment: Estimate the market segment your app aims to capture. For example, if your app focuses on organic products, consider what portion of the online grocery market is attributed to organic sales. Let’s say organic products represent 20% of the total online grocery market.
- Calculate TAM: Multiply the total industry revenue by the relevant market segment percentage to estimate the TAM.
Calculation: TAM = Total Industry Revenue × Market Segment Percentage = $100 billion × 20% = $20 billion.
Top-Down SAM Calculation Example
- Refine to Serviceable Market: Focus on the portion of the TAM that your app can realistically serve. This includes considering your distribution capabilities, geographic reach, and product focus.
- Apply Filters for Target Market: If your app specifically targets urban areas and a younger demographic that is more likely to use mobile apps for grocery shopping, estimate the percentage of the TAM that aligns with this target. Suppose this is 50% of the organic product segment.
- Calculate SAM: Apply this percentage to the TAM to determine the SAM.
Calculation: SAM = TAM × Target Market Segment Percentage = $20 billion × 50% = $10 billion.
Top-Down SOM Calculation Example
- Assess Competitive Position: Analyze your competitive advantage and market share potential within the SAM. Consider factors like app usability, partnerships with grocery stores, pricing, and marketing strategy.
- Estimate Achievable Market Share: Estimate the market share percentage your app can realistically capture within the SAM using the assessments you just made. Let’s assume, based on competitive analysis and your marketing strategy, that you can capture 10% of the SAM in the initial years.
- Calculate SOM: Multiply your estimated market share by the SAM.
Calculation: SOM = SAM × Estimated Market Share Percentage. In this case, $10 billion × 10% = $1 billion.
Bottom-Up Calculation Examples
Sometimes, a top-down approach might not be appropriate, complete, or possible, given your specific situation. So, let’s look at how to take a bottom-up approach to each of these calculations.
Bottom-Up TAM Calculation Example
- Define Target Customer Segments: Identify specific customer segments likely to use the app. For example, urban families, young professionals, and health-conscious individuals.
- Gather Primary Data: Conduct surveys, interviews, or use existing research to determine the average annual spend on online grocery shopping for these target groups. Suppose the average spend is found to be $1,500 per year.
- Estimate the Size of Each Segment: Determine the number of potential customers in each segment. For instance, using census data and market research, you find there are 4 million urban families, 5 million young professionals, and 3 million health-conscious individuals interested in online grocery shopping.
- Calculate TAM for Each Segment: Multiply the number of potential customers in each segment by their average annual spend.
Calculations:
- Urban Families: 4 million × $1,500 = $6 billion
- Young Professionals: 5 million × $1,500 = $7.5 billion
- Health-Conscious Individuals: 3 million × $1,500 = $4.5 billion
Aggregate TAM: Sum the TAM for each segment to get the overall TAM.
Total TAM: $6 billion + $7.5 billion + $4.5 billion = $18 billion
Bottom-Up SAM Calculation Example
- Determine Serviceable Segments: Identify which of these segments your app can realistically serve, considering your product features, distribution capabilities, and marketing reach. Use surveys, focus groups, and beta tests to test this out with different segments. Suppose you conclude that your app is most suited for young professionals and health-conscious individuals.
- Calculate SAM: Add the TAM of these serviceable segments.
Calculation: SAM = TAM of Young Professionals + TAM of Health-Conscious Individuals = $7.5 billion + $4.5 billion = $12 billion
Bottom-Up SOM Calculation Example
- Collect and Analyze Primary Data: Start by gathering data directly from potential customers through surveys, interviews, and focus groups. Focus on understanding their likelihood of using your app, frequency of grocery shopping, and average spending on online grocery purchases.
- Estimate Customer Conversion Rate: Based on the primary data, estimate the percentage of surveyed potential customers who are likely to use your app. For instance, perhaps 15% of the surveyed young professionals and health-conscious individuals indicate they would regularly use your app for grocery shopping.
- Calculate the Estimated User Base: Apply the conversion rate to the total number of potential customers in your serviceable segments.
Calculations:- Young Professionals: 5 million potential customers × 15% conversion rate = 750,000 estimated users
- Health-Conscious Individuals: 3 million potential customers × 15% conversion rate = 450,000 estimated users
- Determine Average Revenue Per User (ARPU): From the primary data, calculate the ARPU by averaging the amount users are willing to spend annually through your app. Suppose the ARPU is found to be $1,200.
- Calculate SOM: Multiply the estimated user base for each segment by the ARPU, and then sum these values to get the SOM.
Calculations:- SOM for Young Professionals: 750,000 users × $1,200 ARPU = $900 million
- SOM for Health-Conscious Individuals: 450,000 users × $1,200 ARPU = $540 million
- Total SOM: $900 million + $540 million = $1.44 billion
Tools and Resources for Market Sizing
Various tools and resources are available to help you estimate your industry’s TAM, SAM, and SOM. Some of these include:
- Industry reports and market research data: These sources provide valuable information about market size, growth trends, and competitive dynamics in your industry. For example, IBISWorld publishes reports on market sizes and growth rates.
- Public financial reports: Publicly traded companies must publish their financial reports; these can provide useful insights into the market size and competitor performance. Look for a 10-K as a good place to start.
- Primary research: Conducting customer surveys, interviews, and other primary research methods can help you gather critical data about your target market and potential market size.
- Market research tools: There are numerous market research tools available, such as SimilarWeb, which can provide on-demand access to dynamic market insights and help you estimate TAM, SAM, and SOM for your industry.
No matter what industry you work in or what type of services you provide, the processes for determining your TAM, SAM, and SOM are both important and not too difficult. They’re great starting points for planning out your marketing strategy.
