


Article's Content
Article's Content
In today’s fast-paced and highly competitive business landscape, Business-to-Business (B2B) SaaS companies must stay on top of their marketing efforts to ensure continued growth and success.
A CMO survey from SaaSCapital finds that the average tech company spent 10% of their annual recurring revenue on marketing in 2022.
This aligns with Gartner’s findings on businesses across the board increasing marketing spending, signaling that marketing departments are back in the C-suite’s good-books after pandemic- and recession-induced contractions.
But, as you can probably guess, these budgets are not without conditions.
The tech market is dynamic and highly competitive. That means the onus is still on the marketing department to prove ROI and justify those budgets.
What’s more, one of the biggest concerns for CMOs going into this year was the ability to provide value to customers across the entirety of their journey—in other words, less focus on vanity metrics and more focus on meaningful metrics.
One of the most effective ways to do this is by closely monitoring key performance metrics that provide insight into the performance of marketing campaigns and strategies.
This blog post will delve into the most important B2B SaaS marketing metrics that the top tech brands focus on and how they use them to optimize their marketing efforts and elevate the bottom line.
What Are B2B SaaS Marketing Metrics?
B2B SaaS marketing metrics are a set of quantitative measurements used to evaluate the effectiveness of a SaaS company’s marketing strategies and campaigns. These metrics provide insight into key areas of the customer journey—from awareness to consideration to conversion and beyond.
And these “marketing” metricscan tell you a surprising amount about your company’s performance overall, for instance:
- How much interest and demand there are in the market for your product
- The specific paths your leads and customers follow as they navigate your various channels
- Where your sales and customer service teams should focus their efforts
- Which messaging resonates with your ideal consumers and power users
- How sustainable your customer acquisition strategy is in the short-, medium-, and long-term
By tracking these metrics, B2B SaaS companies can make data-driven decisions to optimize their marketing efforts, drive growth, and achieve a 360-degree view of their customers.
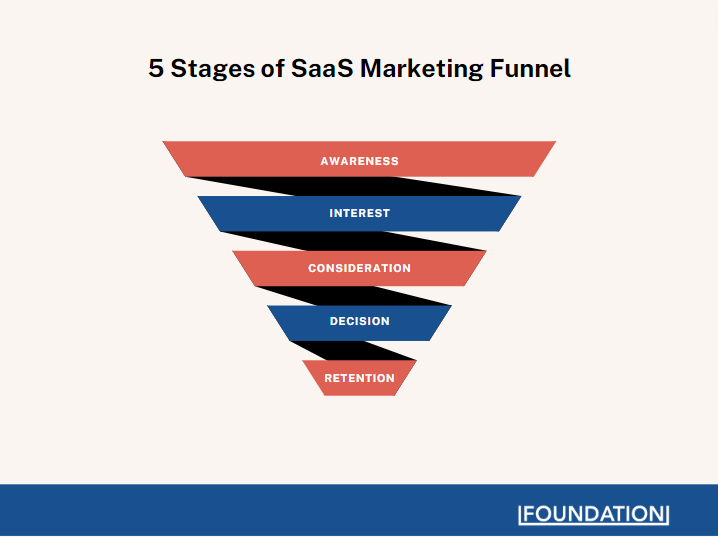
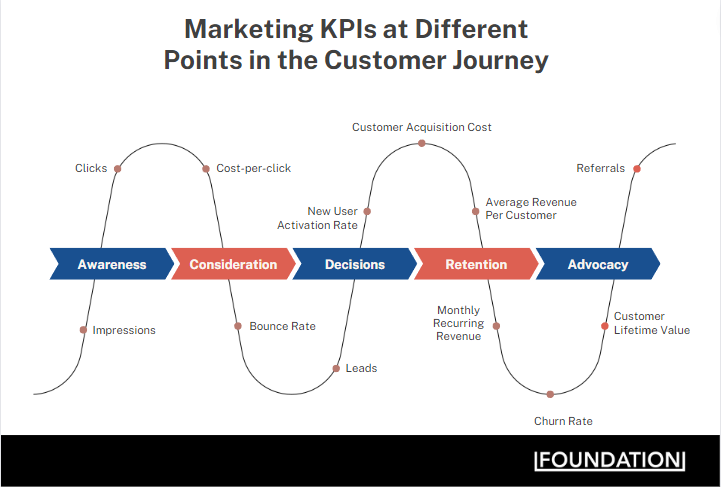
Here’s a look at how some of the metrics we’ll be looking at today fit in along the customer’s journey through your marketing funnel.
Why Are B2B SaaS Marketing Metrics Important?
Business-to-business (B2B) SaaS marketing metrics are essential in understanding the effectiveness of a company’s marketing efforts. They provide insight into how customers interact with a company’s products, services, and promotional campaigns.
By understanding these metrics, companies can adjust their strategies to maximize success.
In particular, B2B SaaS metrics measure the performance of various marketing channels:
- Paid search
- Email campaigns
- Organic search
- Search engine optimization (SEO)
- Content marketing
- Social media activity.
These metrics track which channels generate leads for companies to allocate resources more effectively and identify areas for improvement. For example, if a campaign generates few leads compared to other campaigns, it may be worth looking at the elements that aren’t working or need improvements.
By making improvements based on insights from B2B SaaS metrics, companies can better understand what works and what doesn’t in their campaigns, allowing them to optimize their marketing strategy and increase profits.
Now, you may be wondering, “Which marketing metric is the most important in SaaS marketing?”
Good question. Unfortunately, there’s not a good answer.
To the rest of the C-suite it’s probably MRR or CAC. Seasoned marketers might also throw customer retention or churn into the mix. For others, it might be new user activations or average revenue per customer.
In reality, there’s no one metric in isolation that will give you the answer. Sure, there are some that are consistently brought up as “North Stars,” but you need more than a handful of metrics to gain a full view of your customer’s experiences.
The 17 B2B SaaS Marketing Metrics You Need to Monitor
There are many key metrics you need to track as your customers (or your customers’ customers) progress through the acquisition funnel.
- Web Traffic
- New Users/Unique Visitors
- Bounce rate
- Cost per Lead
- Sales Qualified Lead (SQL) to Lead Conversion Rate
- Sales to Close Ratio
- New User Activation Rate
- Free Trial Conversion Rate
- Average Sale Price (ASP)
- Customer Acquisition Metrics
- CAC Payback Period
- Monthly Recurring Revenue (MRR) Growth
- Average Revenue Per Account (ARPA)
- Customer Lifetime Value (CLTV)
- Total Contract Value (TCV)
- Churn Rate
- Net Promoter Score (NPS)
At the very tip top of the funnel, you’ll likely be looking for those vanity metrics that signal your content is reaching people, and they are showing interest in your product, service, or brand.
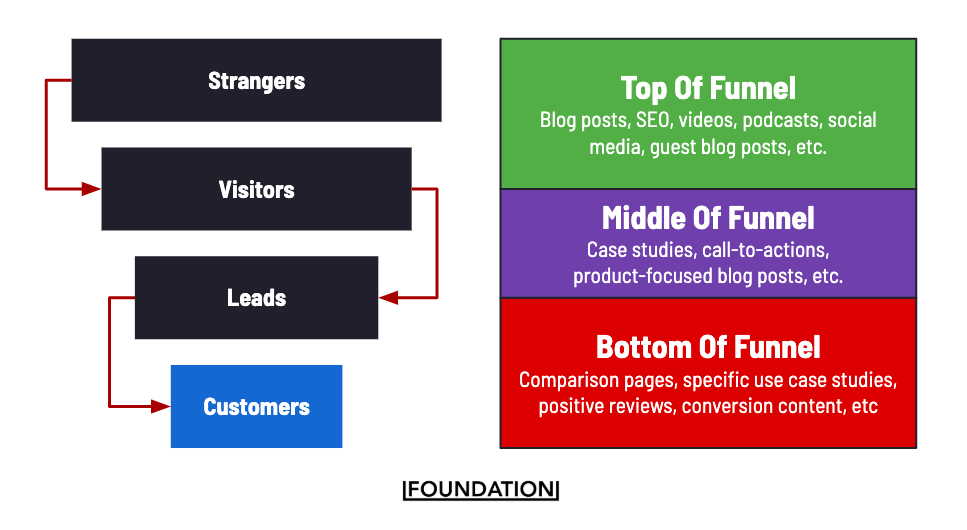
In the middle of the funnel, site visitors become leads as they are qualified by their engagement with and reaction to different forms of content. As they engage with more and more content, visitors allow you to collect contact information and lay the groundwork for their transition into the user or customer stage.
At the bottom of the funnel (and beyond), you get into the marketing metrics that are more closely tied to revenue—customer lifetime value, customer acquisition cost, and monthly recurring revenue.
These are the ones that generally receive the most attention from the rest of the C-suite, but it’s crucial that marketers understand how they all feed into one another.
So, let’s start with the most basic ones and then get to the technical metrics requiring deeper analysis.
Web Traffic
Web traffic is an important metric in B2B SaaS marketing because it allows companies to measure the effectiveness of their digital marketing strategies.
It also provides valuable context as to how users interact with your website, so you can make changes and optimize for maximum engagement. Considering that most SaaS companies offer web-based versions of their app, the ability to bring visitors to your site means you are that much closer to having them use your product.
Web traffic metrics provide key insights into user behavior and can be used to increase conversions and sales.This data can be used to target specific demographics, identify potential customers and gain valuable market intelligence.
Web Traffic Tracking Tools
So, which tools can you use to track your web traffic?
Google Analytics and Search Console are popular choices, as they provide many metrics and reports. They also allow businesses to view their website performance in real time, so they can quickly adjust their marketing strategies accordingly.
Tools such as Ahrefs, Semrush, and Moz can also track web traffic and other top-of-funnel metrics. These tools provide a more in-depth analysis of user behavior and can help companies better understand their audience.
For example, here’s a high-level overview of digital whiteboard giant Miro’s organic search performance on Ahrefs:
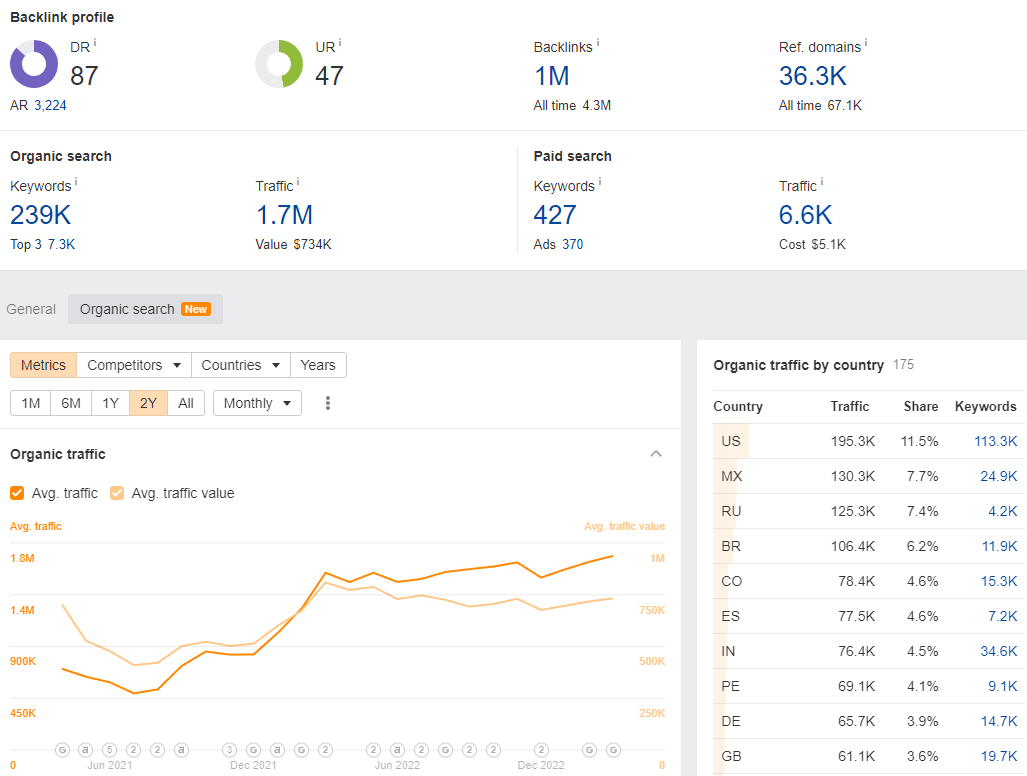
Overall, monitoring web traffic is an essential B2B SaaS marketing metric for understanding customer journeys and optimizing digital marketing strategies for maximum success. With the right tools and metrics, businesses can gain valuable insights into their customers’ behavior and use that data to drive conversions.
Essentially—web traffic is an indispensable B2B SaaS marketing metric that should not be overlooked.
New Users/Unique Visitors
Unique visitors or new users are individuals who visit a website for the first time during a specific time frame, typically a day, week, or month.
While it’s good to be bringing in lots of web traffic, the long-term viability of your business depends on your company’s ability to bring in new customers—and the first step of that journey (or one of them, at least), involves them landing on your website as a unique visitor.
This metric helps SaaS marketers assess the effectiveness of their SEO, content marketing, and social campaigns in attracting new potential customers. It’s also a great way to gauge the overall growth in your audience.
Bounce rate
Bounce rate is one of the most important metrics in any B2B marketing strategy for software-as-a-service companies.
It’s a powerful indicator of how your website content is performing and flags the pages you need to address. Let’s discuss why bounce rate matters and how you can use it to optimize your B2B marketing metrics.
What is Bounce Rate?
In the simplest terms, bounce rate measures how many visitors leave a website after viewing only one page. If someone arrives at a page on your site but doesn’t navigate to any other pages, that counts as a “bounce” and increases your bounce rate percentage.
The higher your bounce rate, the more people leave without taking further action on your site. Tools like Google Analytics let you monitor the bounce rate across all your web pages so you can identify areas where you need to improve the “stickiness” of your content.
This recent post from Ross perfectly outlines how developing a diverse content portfolio helps keep your customers on your website:
Content is more like investing than most people think. pic.twitter.com/86HkHnG5ya
— Ross Simmonds (@TheCoolestCool) March 21, 2023
Why Does Bounce Rate Matter?
Bounce rate can be an incredibly useful metric for B2B marketing strategies because it directly reflects how engaging or interesting web pages are to visitors.
A high bounce rate could indicate that visitors don’t find the content they were looking for or that they were expecting something different based on whether they arrived at your site via organic search, PPC ads, or another channel.
A low bounce rate indicates that people find what they need on the page and then click through to explore more pages on your site. Naturally, this leads to another question:
What is a good bounce rate?
A good bounce rate should be less than 50%, but the ideal rate will vary depending on the page type and industry.
For example, you may have a higher acceptable bounce rate on an educational blog page compared to that of your product’s free-trial, sign-up page. A high bounce rate for the former may just indicate that you have a niche audience, but the latter tells you that something with your lead-capture page is actually turning away potential customers.
Cost per Lead
Lead generation is a critical aspect of B2B SaaS marketing—unfortunately, it’s also not free. There are costs associated with obtaining marketing- and sales-qualified leads, from the CPC of your ads to the hourly rate of your team members who are working on the campaign.
Cost per Lead (CPL) is simply the metric that measures those costs associated with acquiring a new lead.
By breaking down CPL by source and medium, companies can understand which marketing channels are most cost effective for lead generation.This information can be used to optimize marketing strategies and allocate budgets more effectively.
Sales Qualified Lead (SQL) to Lead Conversion Rate
Sales Qualified Lead (SQL) to Lead Conversion Rate is a metric that measures the percentage of leads converted into qualified sales leads.
It is an important metric for SaaS companies as it indicates the effectiveness of their lead generation and qualification process.
A high SQL conversion rate means that the company effectively identifies and nurtures leads most likely to convert into paying customers.
Sales to Close Ratio
Sales to Close Ratio is a metric that measures the number of sales closed divided by the number of sales opportunities.
By breaking down the ratio by source and medium, companies can understand which marketing and sales efforts are most effective in closing sales.
This information can be used to optimize sales and marketing strategies to increase the ratio and improve overall revenue.
New User Activation Rate
New User Activation Rate is a metric that measures the percentage of new users who successfully activate and start using a product.
It’s an important metric for SaaS companies as it indicates how well the product onboarding process works and how easily users can start using the product.
The higher the activation rate, the better the product onboarding process is. The activation rate can be used to identify any friction points in the process and make necessary improvements. This type of metric is crucial for product-led companies that give users access through freemium memberships or free-trial periods.
For example, meeting-scheduling software Calendly has been able to massively increase its user base—and achieve a $3-billion valuation— by activating site visitors as quickly as possible through well-placed CTAs and brand virality.

Free Trial Conversion Rate
Free trial conversion rate (FTCR) is an important B2B marketing metric for SaaS companies, measuring how successful a company’s free trial period is in converting users into paying customers.
This is another product-led strategy, like the freemium model mentioned above. However, instead of limiting the features these active users have access to, free trials provide a full scope of features for a limited length of time.
FTCR gives businesses insights into what customers are looking for and which strategies are helping to convert them. For example, if you have a lot of site visitors signing up for the trial but very few of them actually converting, you may need to adjust your messaging to more accurately reflect your product.
To get even more granular about your FTCR, you want to look past pure sign-up numbers to identify which of these users are active. Activated users are those who are actually using your product in a way that derives value for them.
Free trials are the bread and butter in the SaaS industry. However, this metric’s average conversion rates in the SaaS industry vary based on how your business sets up its free trial.
For example, while more customers will sign up for freemium products or SaaS software that offers a free trial without a credit card, fewer people are likely to convert. But, this number changes significantly with credit registration requirements of as much as 25%.
What Factors Impact FTCR?
Several factors impact FTCR, and they are by no means uniform across tech niches or product types. Here are a few of the most common factors that impact the conversion rate:
- The length of the free trial period
- The features offered during the trial
- The complexity of your product
- The level of difficulty and friction during sign-up
For example, longer trials tend to have higher conversion rates, as customers have more time to explore the product and get more familiar with the range of features.
How Can Companies Improve Their FTCR?
Companies can improve their FTCR by focusing on user experience throughout the entire process, from signing up for the free trial to converting into a paying customer. If signing up for the free trial is too difficult or time consuming, potential customers may be discouraged from taking advantage of it.
Here are a few tips for you if you want the free users to become paying customers:
- Optimize sign-up forms to reduce friction and increase the conversion rate.
- Provide helpful resources, such as tutorials or webinars, during the trial period.
- Offer special discounts or incentives for completing the free trial early.
The experts at Product-Led suggest that the optimal trial model you offer to activate users varies based on both price and complexity, with free trials best suited for low-price, high-complexity products.
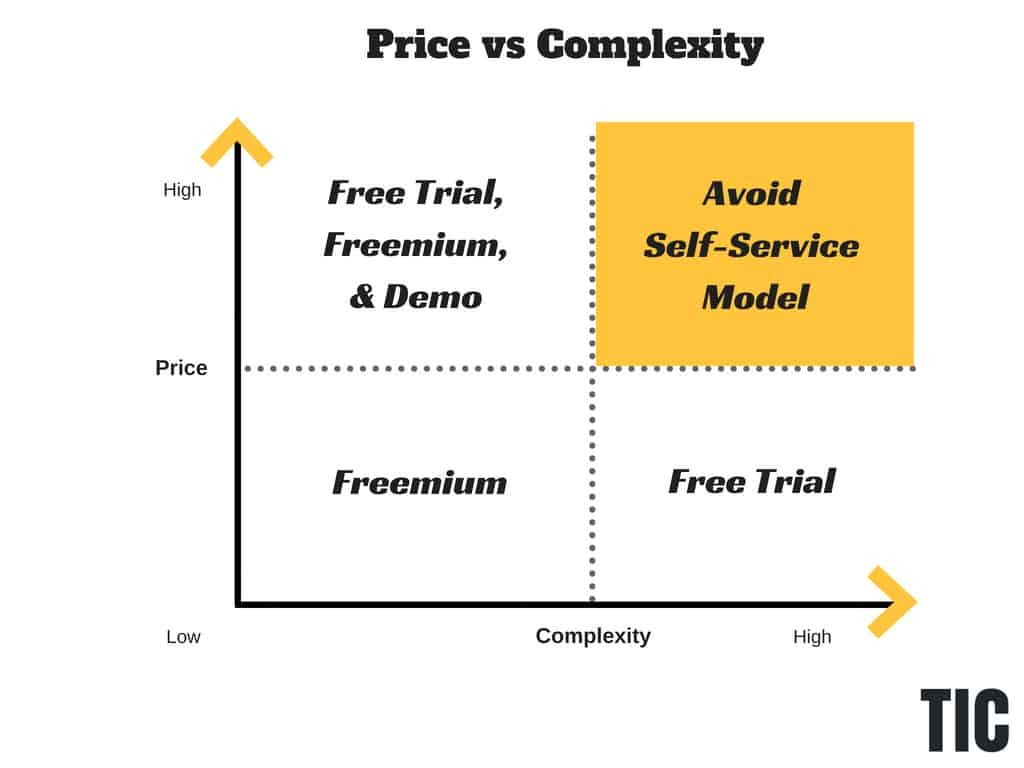
Image source:https://productled.com/blog/how-to-improve-free-trial-conversion-rate
Average Sale Price
Average sale price (ASP) is the average amount of revenue generated per closed deal, which is calculated by dividing the total revenue by the number of closed deals.
ASP helps marketers understand the effectiveness of pricing strategy, assess the value (and limitations) of their product offering, and identify opportunities for up- and cross-selling.
ASP is a crucial metric for B2B SaaS business to know estimate revenue generation and recognition by understanding the value of new customer contracts and their pattern of subscribing to your product and services.
Customer Acquisition Metrics
Customer acquisition metrics are used to track and measure how effective a company’s marketing and sales efforts are at converting customers.
In the context of B2B SaaS marketing, these metrics can help a company understand the cost and effectiveness of different marketing and sales channels and the sales team’s overall performance.
Some specific examples of customer acquisition metrics for B2B SaaS companies include:
- Cost per acquisition (CPA): the total cost of acquiring a new customer, including marketing and sales expenses
- Lead-to-customer conversion rate: the percentage of leads that convert into paying customers
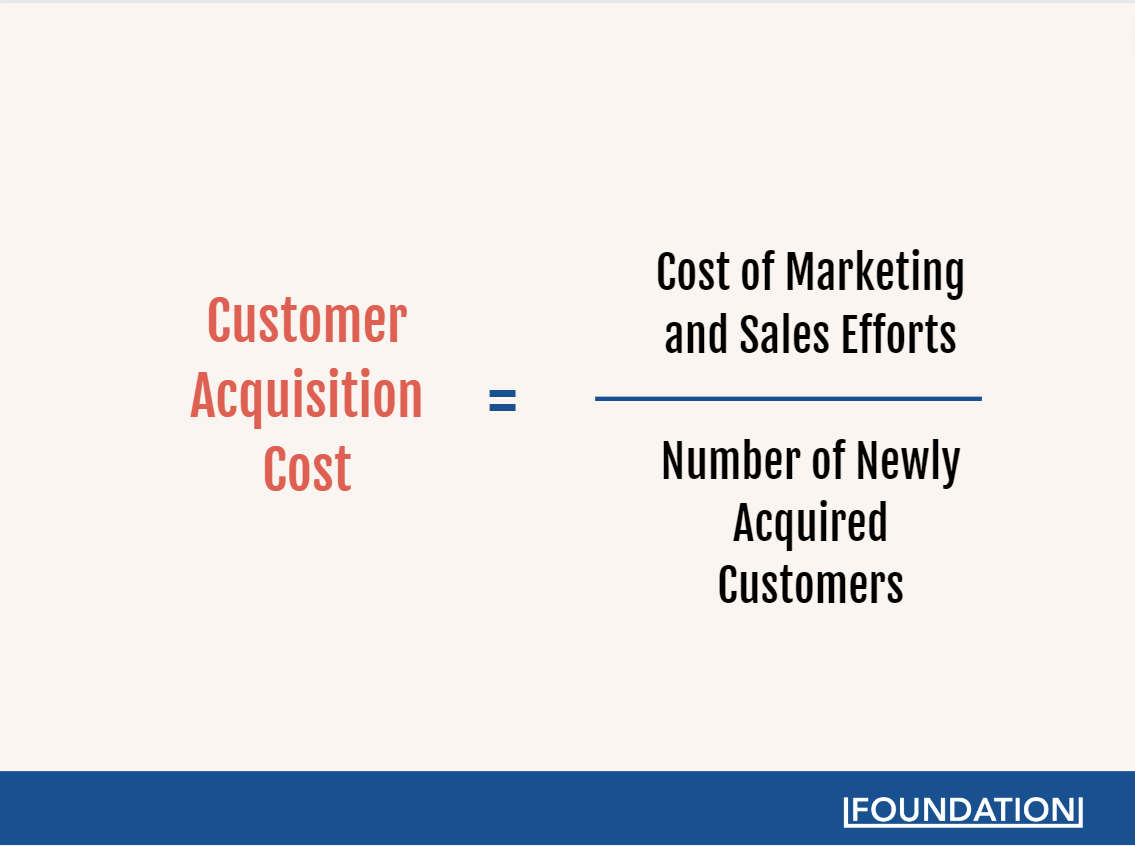
- Customer acquisition cost (CAC): the cost of sales and marketing efforts divided by the number of new customers acquired
- Channel-specific acquisition metrics: the number and cost of customers acquired through different marketing channels (e.g., social media, email marketing, etc.)
- Sales productivity metric: the number of calls, meetings, demos, and proposals made per sales rep.

By tracking these metrics over time, a B2B SaaS company can identify areas where they are performing well and areas that need improvement in order to make data-driven decisions to optimize their customer acquisition strategy.
CAC Payback Period
CAC payback period is the amount of time it takes for a business to recoup its customer acquisition cost through customer-generated revenue. It is calculated by dividing the CAC by the average revenue per customer. This metric helps businesses understand how quickly they can recover their investment in acquiring new customers and assess the sustainability of their growth.
Monthly Recurring Revenue (MRR) Growth
MRR growth is the increase in subscription-based revenue on a month-to-month basis. It is calculated by comparing the MRR at the end of a month to the MRR at the end of the previous month. This metric is crucial for subscription-based businesses as it showcases the health of their recurring revenue model, as well as the effectiveness of their customer acquisition, retention, and upselling efforts.
A positive MRR growth rate indicates that the company is expanding its customer base and generating more revenue.
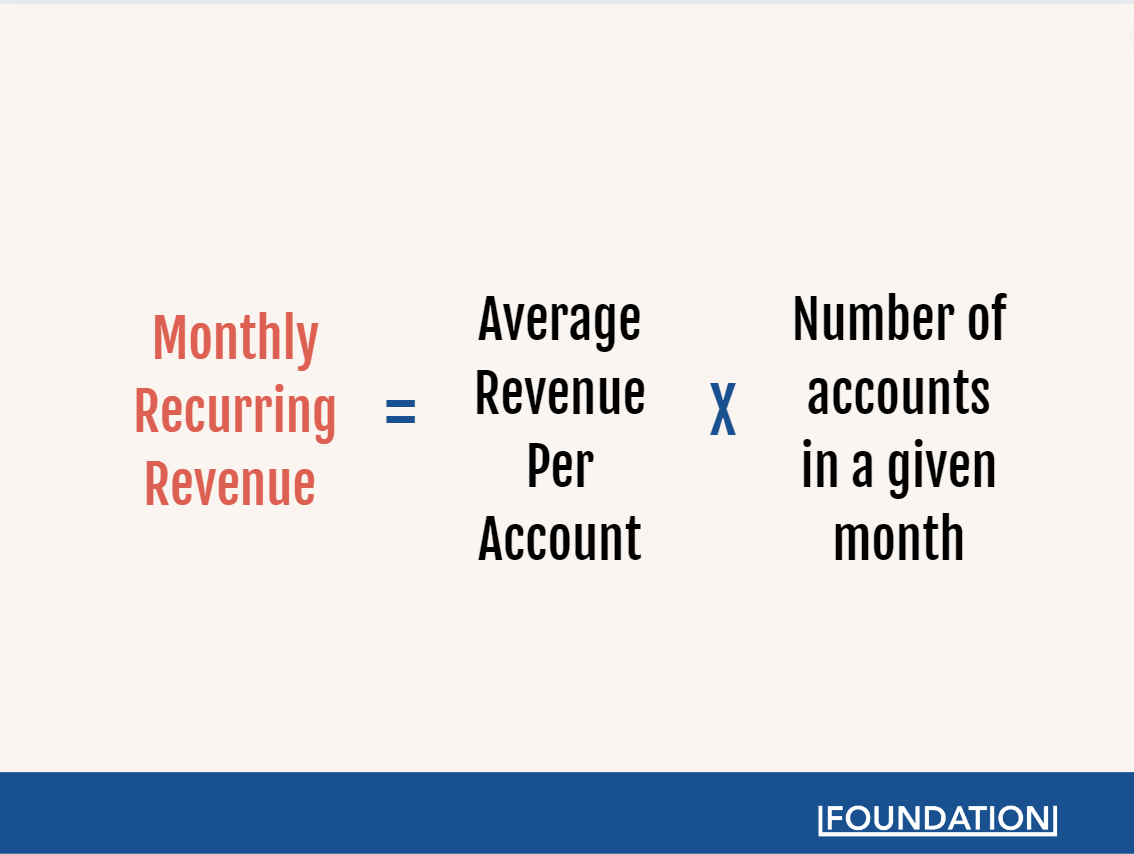
Average Revenue Per Account (ARPA)
ARPA is the average revenue generated from each customer account, usually measured on a monthly or annual basis. It is calculated by dividing the total revenue by the number of active customer accounts. ARPA helps businesses assess the value of their customer base and identify opportunities to increase revenue through upselling, cross-selling, or improving customer retention. By tracking ARPA, companies can identify large customers and focus on expanding their accounts.
Customer Lifetime Value (CLTV)
Customer Lifetime Value (CLTV) is the total revenue generated from a customer over the entire duration of their relationship with a company. It is calculated by multiplying the average revenue per customer by the average length of a customer relationship, then subtracting the customer acquisition cost. CLTV helps businesses understand the long-term value of their customers, optimize their marketing and sales efforts, and prioritize investments in customer retention and growth.
Total Contract Value (TCV)
TCV is the total value of all contracts signed within a given period, such as a quarter or a year. It includes both one-time fees and recurring revenues, as well as any discounts or incentives applied to the contracts. TCV helps businesses gauge the success of their sales efforts and provides insights into the overall growth and profitability of the company.
Churn Rate
The churn rate is a key metric for businesses that sell software as a service (SaaS). It measures the percentage of customers who cancel their subscriptions within a given period.This metric can help marketers understand customer retention, loyalty, and lifetime value.
For example, if you have 100 customers at the start of the month and 10 cancel their subscriptions during that same period, your churn rate would be 10%.
It’s important to note that the churn rate only measures cancellations—it doesn’t account for other types of customer attrition, such as upgrades and downgrades in service level or failed payments.
Why is Churn Rate Important?
Churn rate is an important metric because it gives marketers insight into customer retention and loyalty.
If your churn rate is high, it could indicate that you’re not providing high-quality products or services or that your pricing isn’t competitive enough. On the other hand, if your churn rate is low, it could mean that you’re doing something right and should continue on this path.
How to Calculate Churn Rate?
Calculating the churn rate is relatively straightforward—you divide the number of customers who canceled their subscriptions in a given period by the total number of customers at the start.
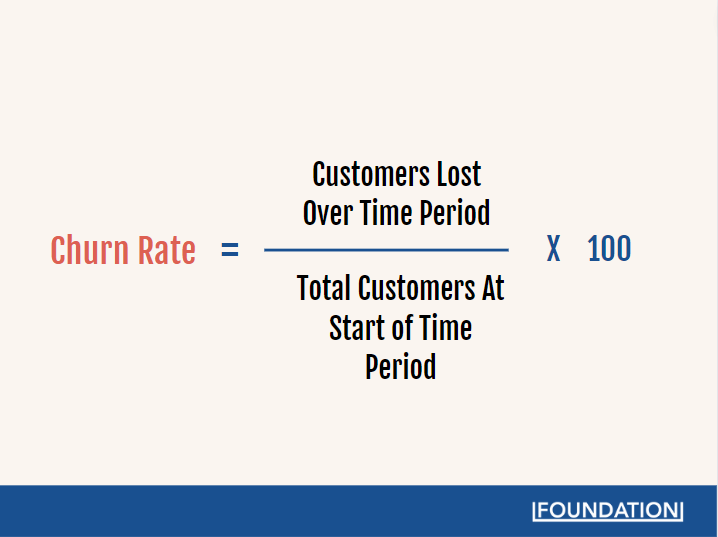
Then multiply this figure by 100 to get the percentage. For example, if 20 out of 100 customers canceled their subscription during one month, your churn rate would be 20%.
Net Promoter Score (NPS)
Net Promoter Score (NPS) is a metric that measures customer satisfaction and loyalty. It is calculated by asking customers how likely they are to recommend a product or service to a friend or colleague.
NPS is an important metric for SaaS companies as it indicates the business’s overall health and can be used to identify areas for improvement.
Marketing Contribution to Revenue
Knowing how much of an impact marketing has on your company’s bottom line is essential for making informed decisions about your marketing strategy and investments.
Simply put, marketing contribution to revenue measures the amount of money that comes into your business due to your marketing efforts.
This metric looks at all sources of revenue that have been generated by any type of marketing activity, such as advertising campaigns, content creation, promotion, web design, SEO, etc. It takes into account both short-term and long-term results.
In other words, it looks at immediate sales from promotions or campaigns and long-term relationships built over time through content creation and other strategies.
Measuring Marketing Contribution to Revenue
To accurately measure this metric in a B2B SaaS company, you need to track two key pieces of information: total revenue earned from customers acquired through marketing activities and the total amount spent on those activities.
A good way to do this is by attributing each customer acquisition cost (CAC) back to its source.
This will give you an accurate picture of where each dollar comes from and which strategies yield the most return on investment (ROI).
You can then use these insights to make more informed decisions about where you should invest resources of time or money.
Frequently Asked Questions (FAQs)
So, you now have a better understanding of the metrics that are most important to marketing leaders in the B2B SaaS space.
But, in case there are any lingering questions, here are a few of the FAQs we get at Foundation regarding B2B SaaS marketing metrics:
What Are The Top 3 Key Saas Marketing Metrics To Track?
Each of the metrics listed above is important—and ensuring that your strategy incorporates measures to track each of them is highly recommended.
Still, when push comes to shove, you all want to know what’s really the most important to your business. And that answer is a little more clear: money.
More precisely, the metrics show that the amount of money your SaaS company makes is enough to propel you from startup to established brand and beyond.
From this perspective, these3 key SaaS marketing metrics are essential for you to track:
- Monthly Recurring Revenue (MRR) growth.
- Customer Acquisition Cost (CAC) and CAC payback period.
- Conversion rate (sign-ups, free trial to paid, etc.)
To dive even further into the realm of the metrics that leading SaaS marketers care about, check out this video:
What Is Needed To Be Successful in the B2B SaaS Marketing Space?
To be successful in the B2B SaaS marketing space, it’s crucial to understand your target audience, develop a strong product, and employ effective marketing strategies. Here are several key factors to consider when aiming for success in B2B SaaS marketing:
- Product-Market Fit: Ensure that your SaaS product addresses a genuine need or pain point for your target customers. Conduct thorough market research to validate the demand for your product and make improvements based on customer feedback.
- Target Audience: Clearly define your target audience, including their roles, industries, and company sizes. This will help you tailor your marketing messages and strategies to effectively reach your potential customers.
- Unique Value Proposition (UVP): Clearly articulate the unique benefits your product offers compared to competitors. Your UVP should be concise, easy to understand, and effectively communicate the value your product provides.
- Marketing Strategy and Execution: Develop and execute a comprehensive marketing strategy that includes content marketing, search engine optimization (SEO), social media marketing, email marketing, and paid advertising. By utilizing various channels and tactics, you can generate leads, build brand awareness, and nurture relationships with your target audience.
- Customer Success and Retention: Provide exceptional customer support and invest in customer success initiatives. This will not only retain existing customers but also turn them into brand advocates, generating referrals and positive reviews.
- Analytics and Measurement: Regularly track and analyze key performance indicators (KPIs) to gauge the success of your marketing efforts. Use these insights to optimize your strategies and make data-driven decisions.
- Collaboration and Integration: Work closely with your sales, product, and customer success teams to ensure alignment and create a seamless experience for your customers.
By focusing on these key areas, you can build a strong foundation for your B2B SaaS marketing efforts and set your company up for long-term success.
What is “The Rule of 40%” for Saas Company Success?
Although it’s not purely a marketing metric, it’s important that anyone working in the tech space is aware of the Rule of 40%. This number is often cited as a benchmark for investors and stakeholders who want to determine whether a tech SaaS company is well-positioned for long-term financial success.
The Rule of 40% is calculated by adding a company’s growth rate and its profit margin. If the result is 40% or higher, the company is generally considered to be performing well.
Here’s the formula:
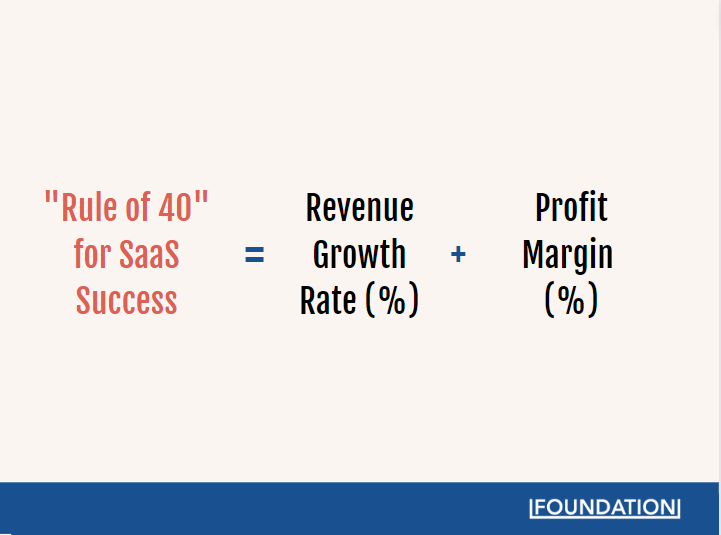
The revenue growth rate represents the percentage increase in a company’s revenue over a specific period, typically a year. The profit margin is the percentage of profit that the company makes from its total revenue.
The Rule of 40% implies that a SaaS company should aim for a combined growth rate and profit margin of at least 40%. A higher percentage indicates a healthier and more successful company. However, it’s essential to understand that the Rule of 40% is just a guideline and not a definitive measure of success. Different SaaS companies may have different growth trajectories, business models, and market conditions that can affect their performance.
The Final Verdict on B2B SaaS Marketing Metrics
As we can see, B2B SaaS marketing metrics play a crucial role in the success of a business, as they provide important information that allows organizations to understand how their marketing initiatives are performing.
Generating leads, improving customer lifetime value, and gaining more customers are essential for any company. Monitoring the following metrics can ensure that all B2B SaaS businesses remain competitive in a crowded market:
- Web Traffic
- New Users/Unique Visitors
- Bounce rate
- Cost per Lead
- Sales Qualified Lead (SQL) to Lead Conversion Rate
- Sales to Close Ratio
- New User Activation Rate
- Free Trial Conversion Rate
- Average Sale Price (ASP)
- Customer Acquisition Metrics
- CAC Payback Period
- Monthly Recurring Revenue (MRR) Growth
- Average Revenue Per Account (ARPA)
- Customer Lifetime Value (CLTV)
- Total Contract Value (TCV)
- Churn Rate
- Net Promoter Score (NPS)
Furthermore, with real-time insights, companies can adjust their strategy quickly to capitalize on opportunities or mitigate any risks associated with their marketing efforts.
With the right awareness and utilization of key performance metrics, you can steer your tech company toward the heights of giants like Miro, Calendly, and Slack.
