


Article's Content
Article's Content
When someone asks ChatGPT, “What’s the best CRM for small businesses?,” there’s no page two.
Your brand either exists in that response or it’s invisible.
It’s you or them, baby.
That’s why Generative Engine Optimization (GEO) is a priority for every marketer right now. But how do you know where your brand stands across a handful of LLM-powered platforms?
Unlike SEO or paid media, there’s no precedent, and attribution is near impossible. The typical ROI frameworks that worked for traditional content marketing don’t translate here.
GEO demands a whole new set of metrics — ones built for zero-click environments and AI-mediated discovery. Let’s unpack how to measure GEO in a way that reflects how buyers actually discover and evaluate brands in AI-first environments.
Why Generative Engine Optimization Needs New Metrics
There’s a growing debate in marketing circles that’s generating more heat than light. On one camp: “GEO is just SEO with a new name.” On the other: “SEO is dead — AI search changes everything.”
But they’re missing the point.
The real issue isn’t whether GEO replaces SEO or extends it. It’s that the metrics we’ve relied on for decades — rankings, organic traffic, click-through rates — don’t capture what’s happening when buyers get answers directly from AI. The debate over terminology obscures the real issue: traditional attribution models fail in zero-click environments, and our metrics haven’t caught up.
The Attribution Problem in Zero-Click Environments
GEO operates in places where traditional tracking breaks down. When someone asks ChatGPT for software recommendations, gets an answer that includes your brand, and goes to your website three days later — you have no way to connect those dots.
As James Scherer, VP of Strategy at Foundation, puts it:
“The [return on investment] depends entirely on how the company has set up their marketing funnel. GEO operates in zero-click environments like ChatGPT, AI Overviews, and Reddit threads, and you can’t track user behavior on platforms you don’t own. Multi-touch attribution breaks down when the ‘touch’ happens outside your ecosystem.”
Think about it. When a prospect checks “ChatGPT” on your signup form’s “how did you hear about us” field, who gets the credit:
- The dev team who optimized your site for LLM crawling?
- The SEO team who built the comparison page that the AI cited?
- The PR team who secured the industry publication mention?
- The community manager who contributed to a frequently-cited Reddit thread?
- The content team whose YouTube video appeared in the response?
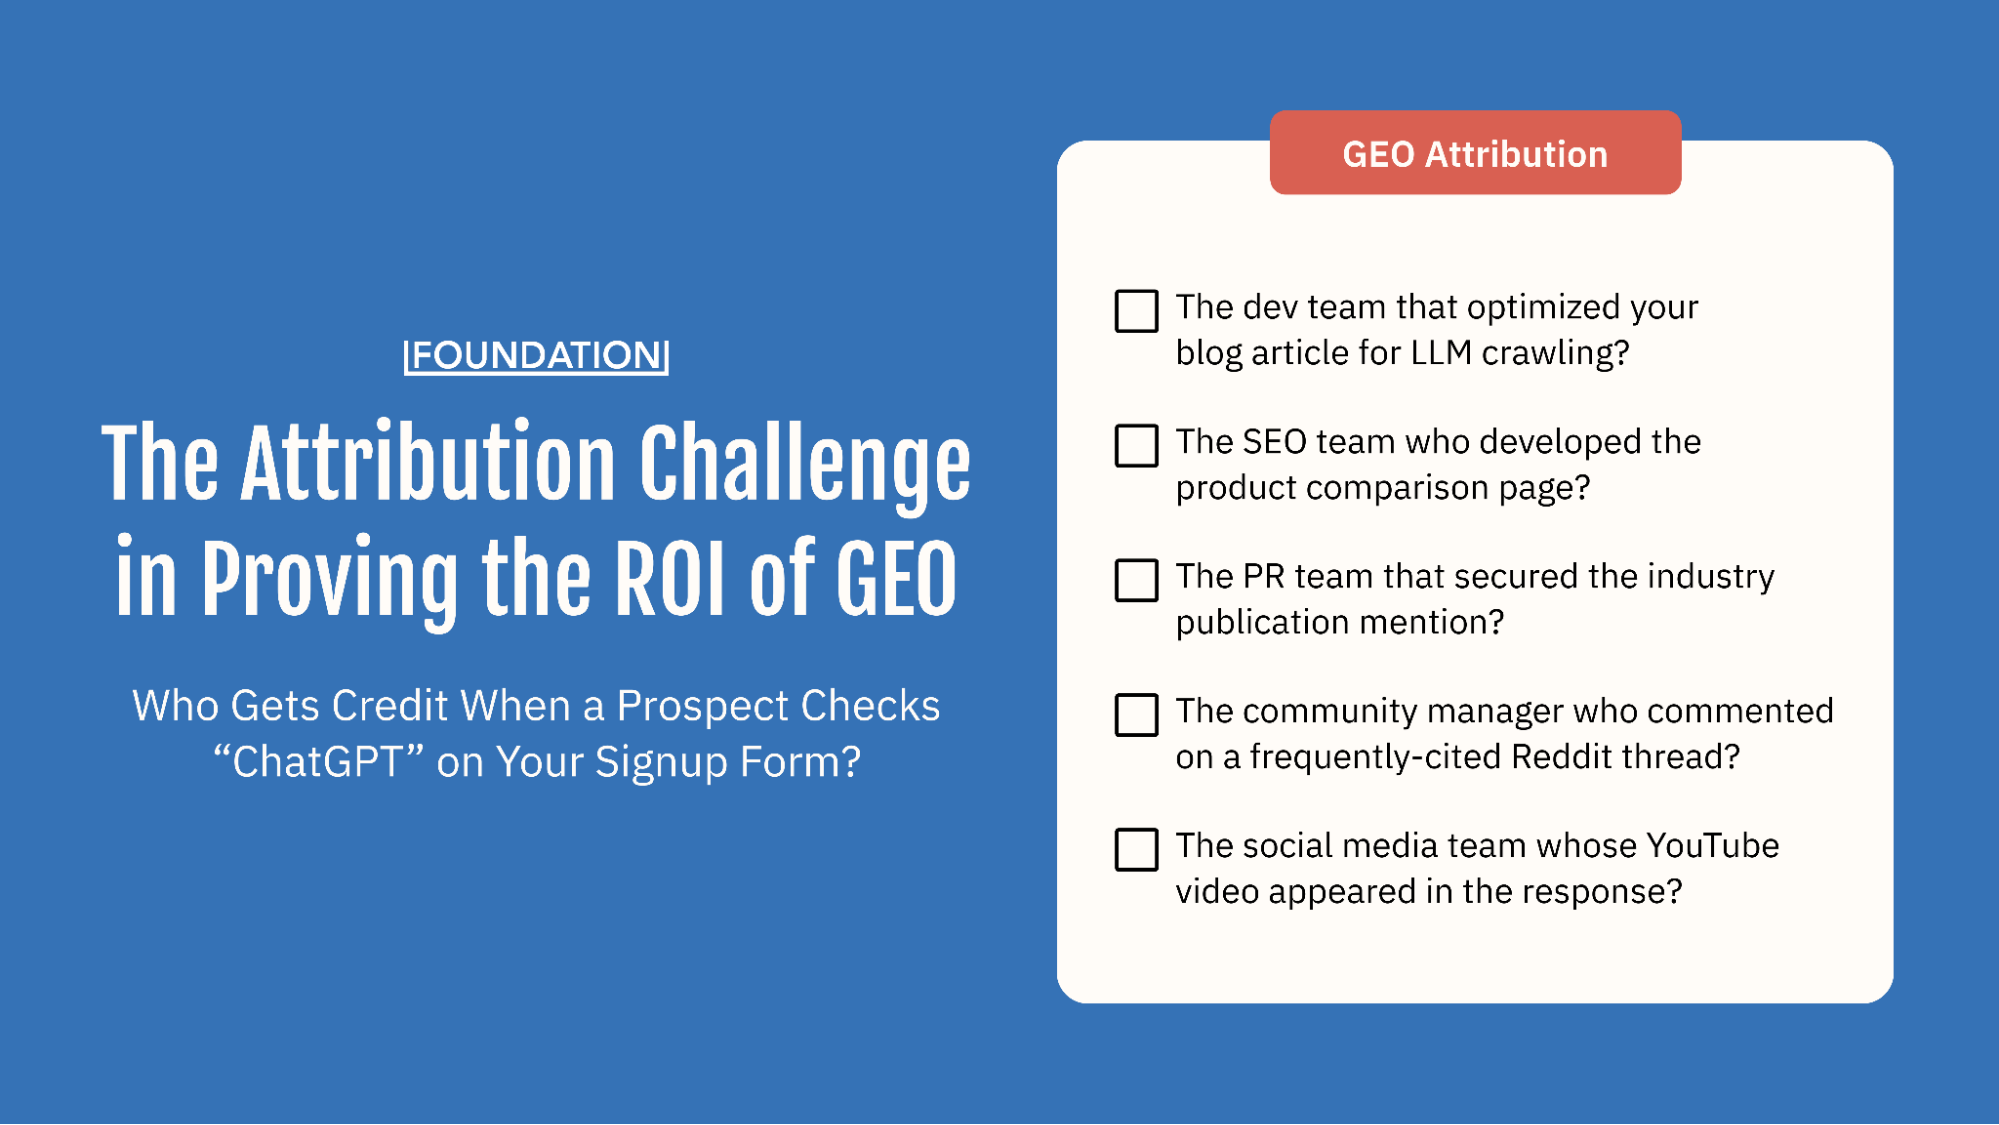
The honest answer is that all of them contributed. This is exactly why isolating the ROI of GEO using traditional attribution models is so difficult and often counterproductive.
But that doesn’t mean that tracking your generative engine optimization performance is futile. Far from it.
But you do need to expand the tracking you’re currently doing to include PR-style brand awareness metrics that can give you a real picture of what’s happening and how to make improvements.
GEO Is Brand Awareness, Not Performance Marketing
Reframing how you think about your GEO investment may help you accept the attribution limitations it brings.
Yes, you can capture AI referral traffic in Google Analytics. And yes, you can set up forms to track referrals from ChatGPT. In fact, earlier this year, Tally reported that 25% of their new signups checked off AI search on their lead capture form. Docebo’s VP of Revenue Marketing shared that 13% of their high-intent leads come through AI discovery.
But for most brands, GEO functions more like PR, brand campaigns, thought leadership initiatives, or industry event sponsorships than performance marketing. It influences buyer behaviour and strengthens market position. But it doesn’t offer clean, direct attribution to revenue.
The typical ROI calculations don’t do these efforts justice.
Think of GEO as infrastructure investment, not tactical marketing spend. Similar to investing in CRM systems before proving direct revenue impact, or developing brand guidelines without calculating exact ROI, GEO represents the infrastructure required to compete in an AI-mediated research environment.
So, instead of asking that ol’ ROI question, brands need to reframe:
What’s the opportunity cost of ceding territory to competitors across every AI platform your buyers are using?
That shift opens the door to a measurement framework that can shows you how often AIs surface your brand and what they say about you. In other words, how likely you are to be a part of a buyer journey that starts with an AI tool.
The Three Pillars of GEO Measurement
If traditional SEO and owned-channel tracking methods don’t work, what does?
The answer is a tracking system built around three pillars:
- Visibility (do they see me?)
- Citation (do they trust me?)
- Sentiment (do they like me?).
Each pillar answers a different question about your brand’s position in AI-generated responses.
Visibility tells you whether you’re showing up at all.
Citation tells you whether the AI considers you a credible source worth linking to.
Sentiment tells you whether that visibility is helping or hurting your brand.
You need all three.
A brand can have high visibility but negative sentiment — appearing frequently while being described as overpriced or outdated. It can have great sentiment in the few responses where it appears, but almost no visibility. The pillars work together to give you the full picture.
Here’s a breakdown of the specific metrics within each pillar:
| Metric Category | Metric Name | What It Measures | |
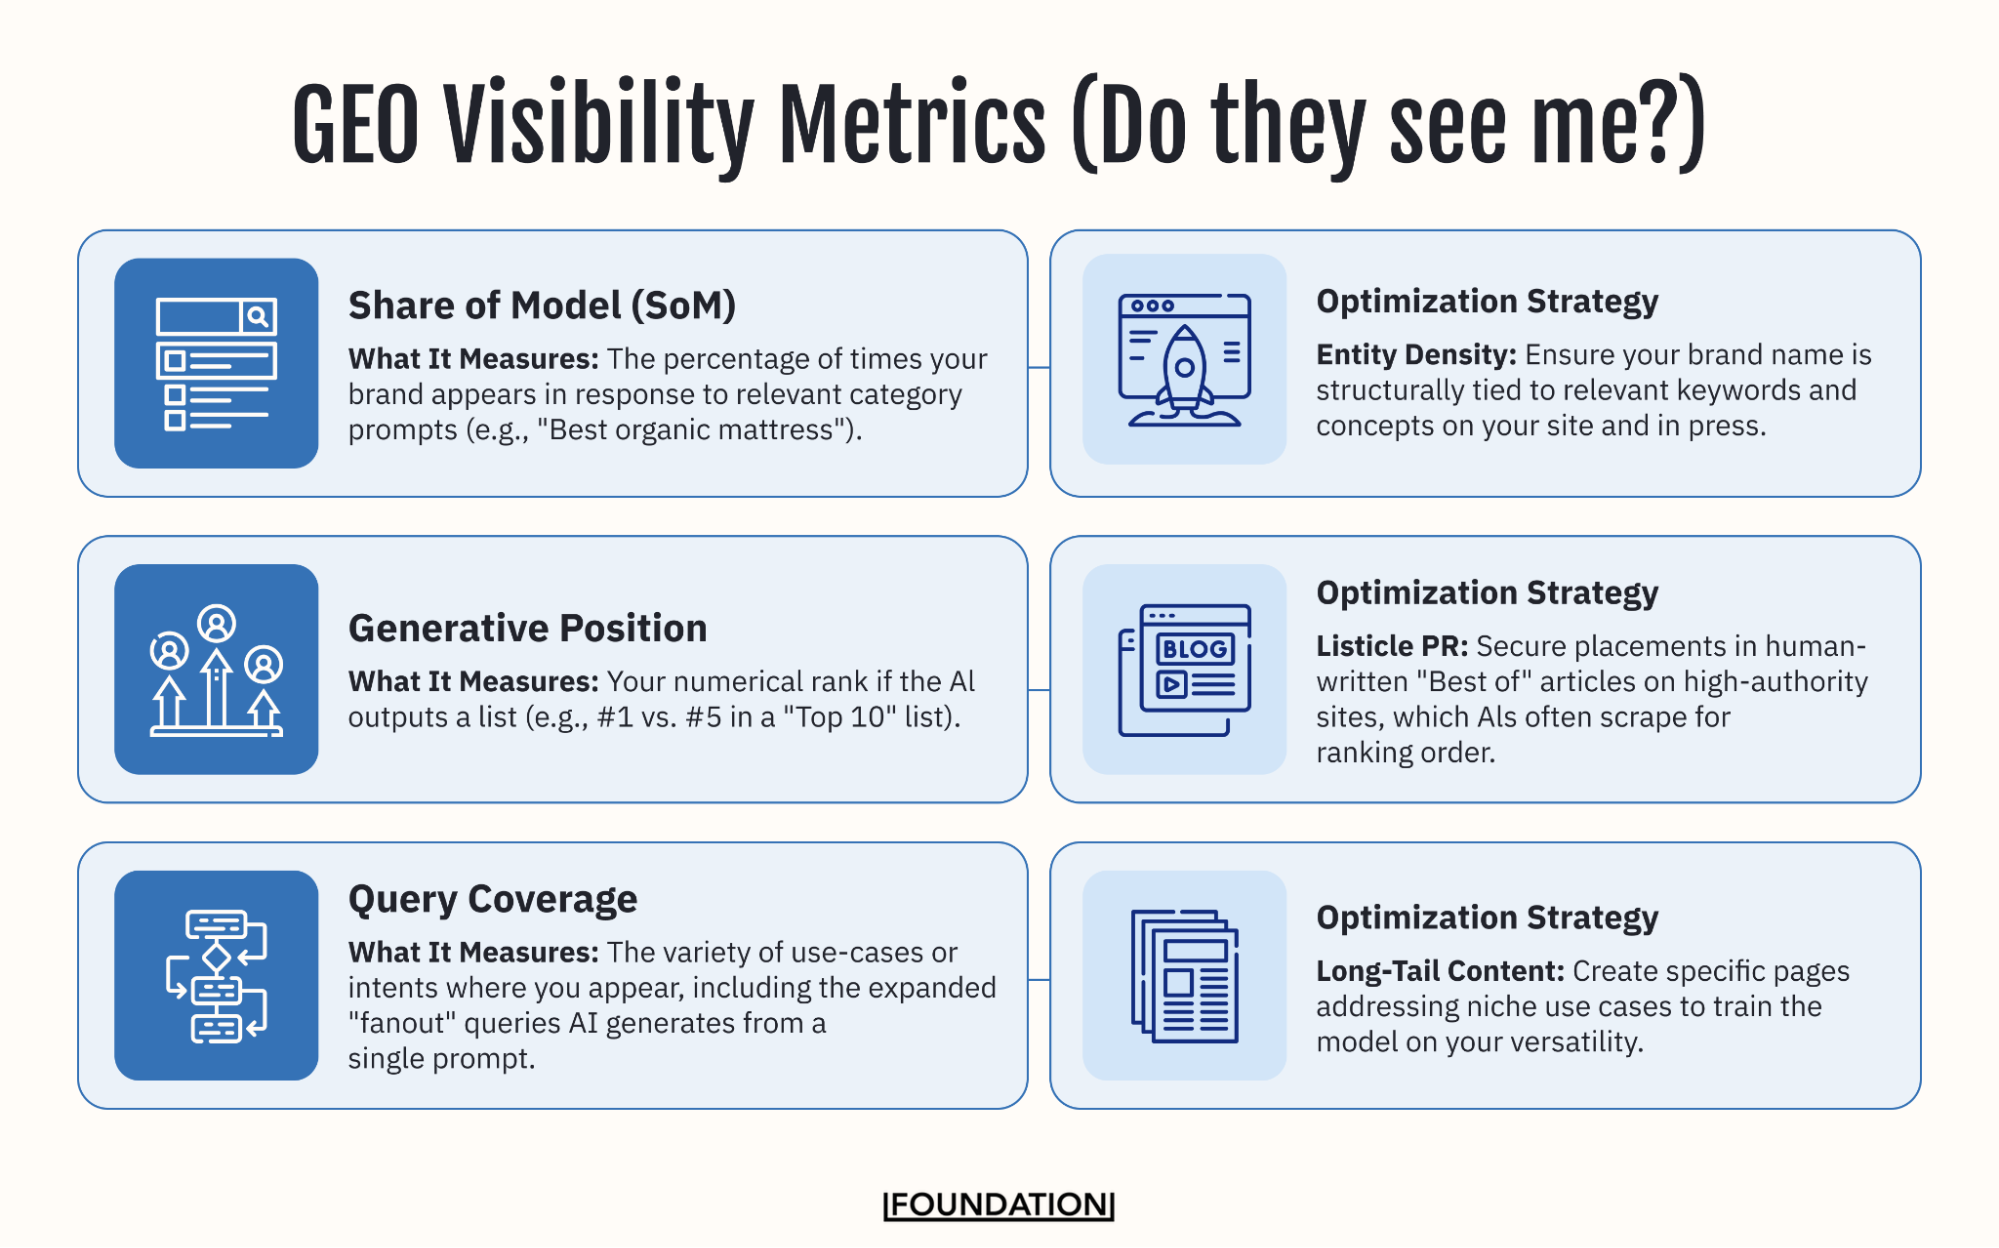
| Visibility | Share of Model (SoM) | The percentage of times your brand appears in response to relevant category prompts (e.g., “Best organic mattress”). | |
| Generative Position | Your numerical rank if the AI outputs a list (e.g., #1 vs. #5 in a “Top 10” list). | ||
| Query Coverage | The variety of use-cases or intents you appear in, including the expanded “fanout” queries AI generates from a single prompt. | ||
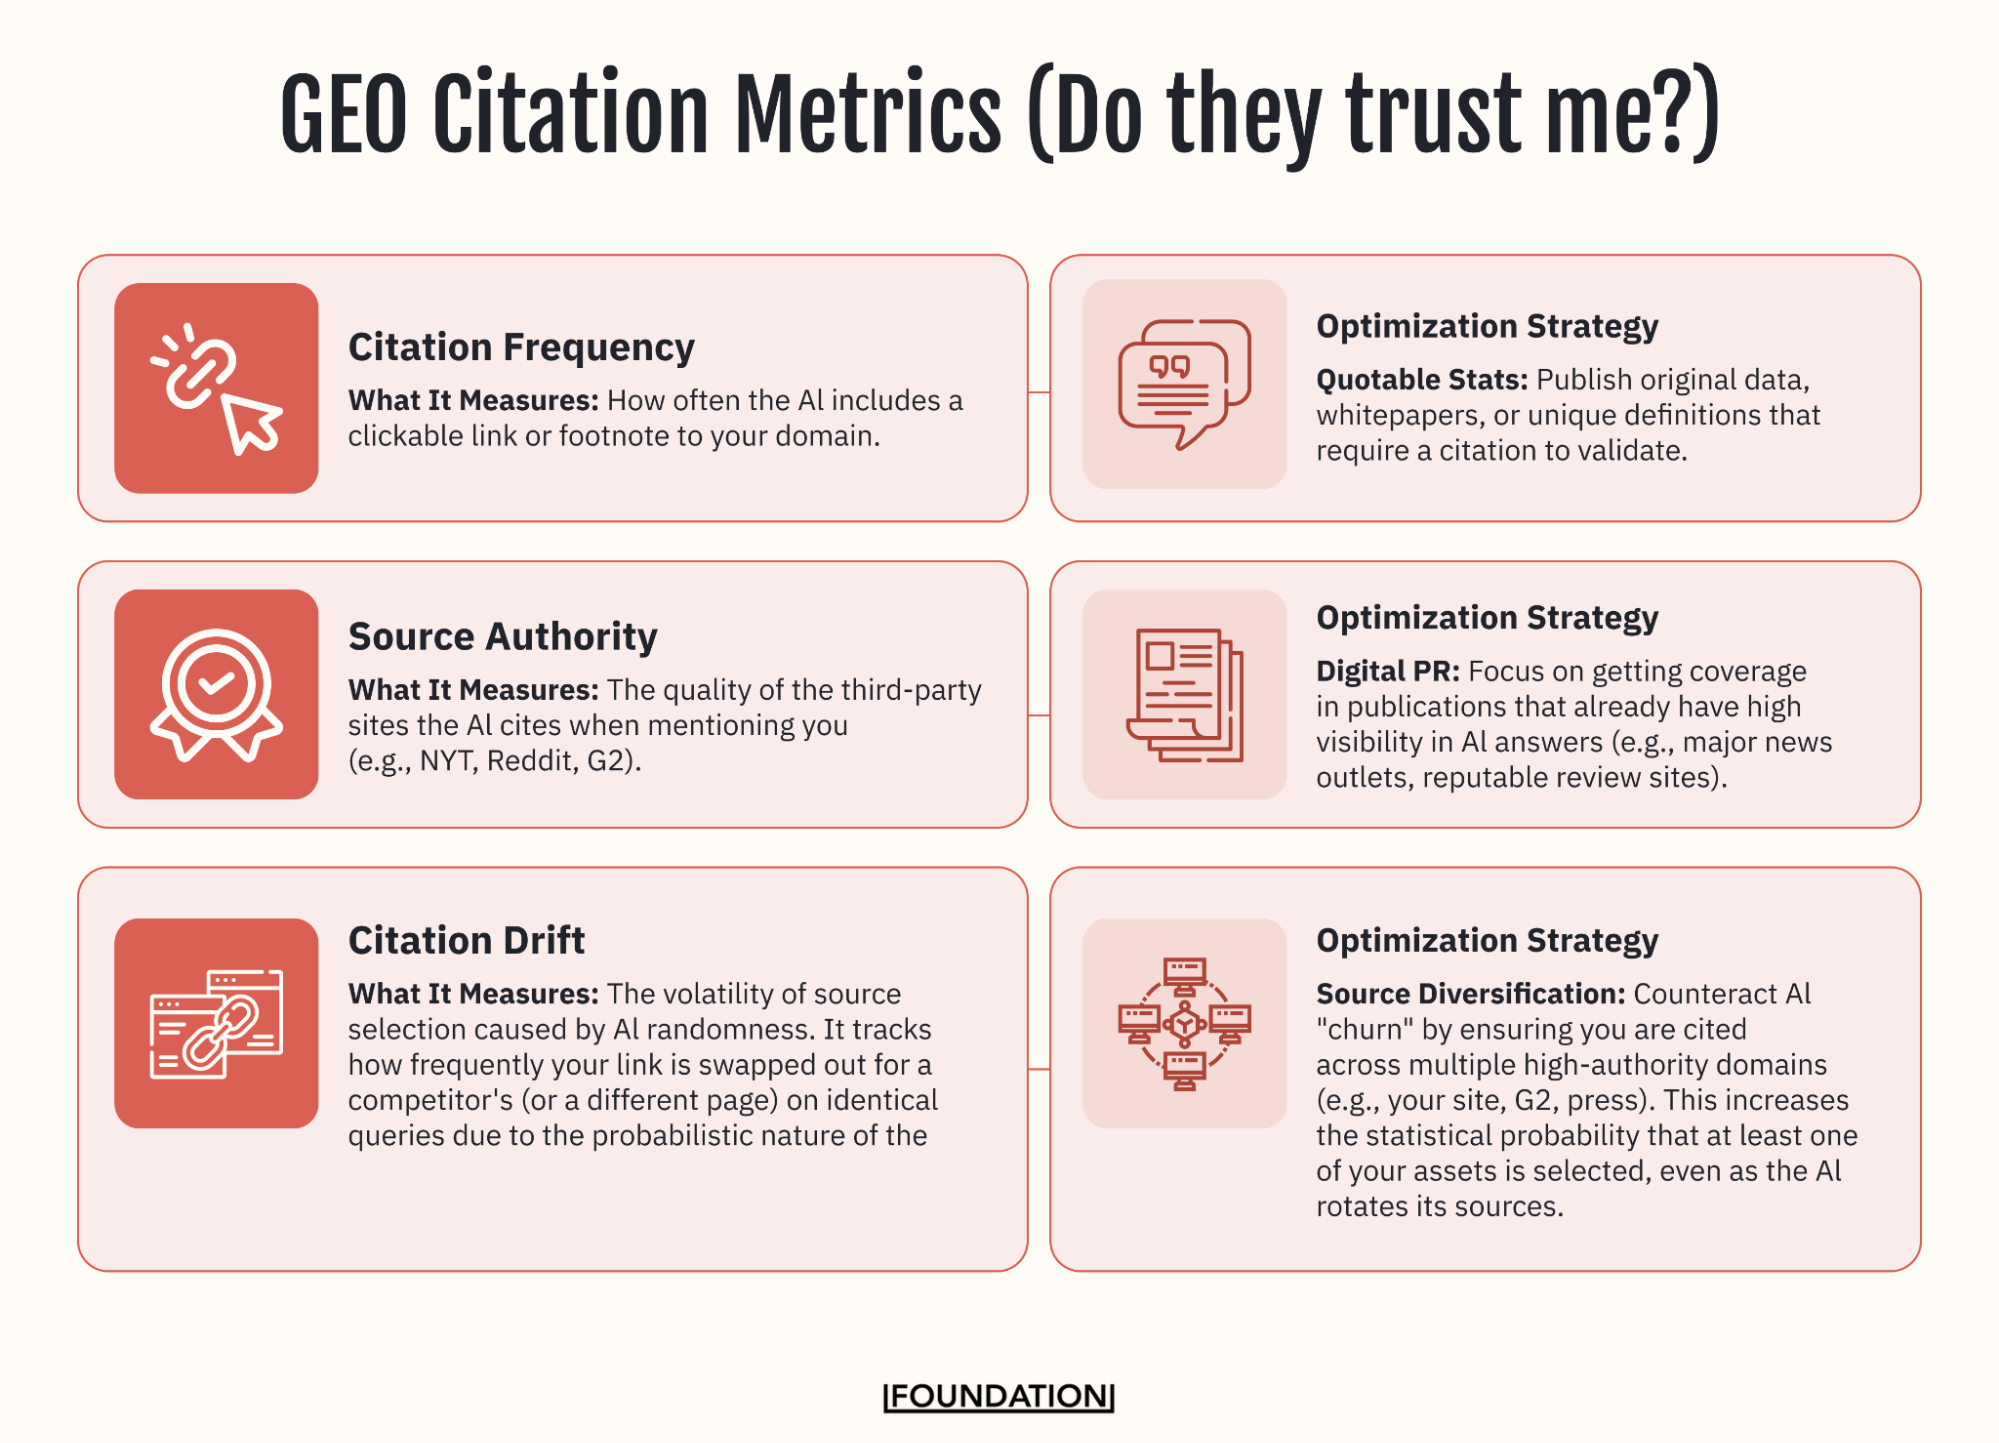
| Citations | Citation Frequency | How often the AI includes a clickable link or footnote to your domain. | |
| Source Authority | The quality of the third-party sites the AI cites when mentioning you (e.g., NYT, Reddit, G2). | ||
| Citation Drift | How frequently your brand’s coverage is swapped out for a competitor as the model rotates through sources. | ||
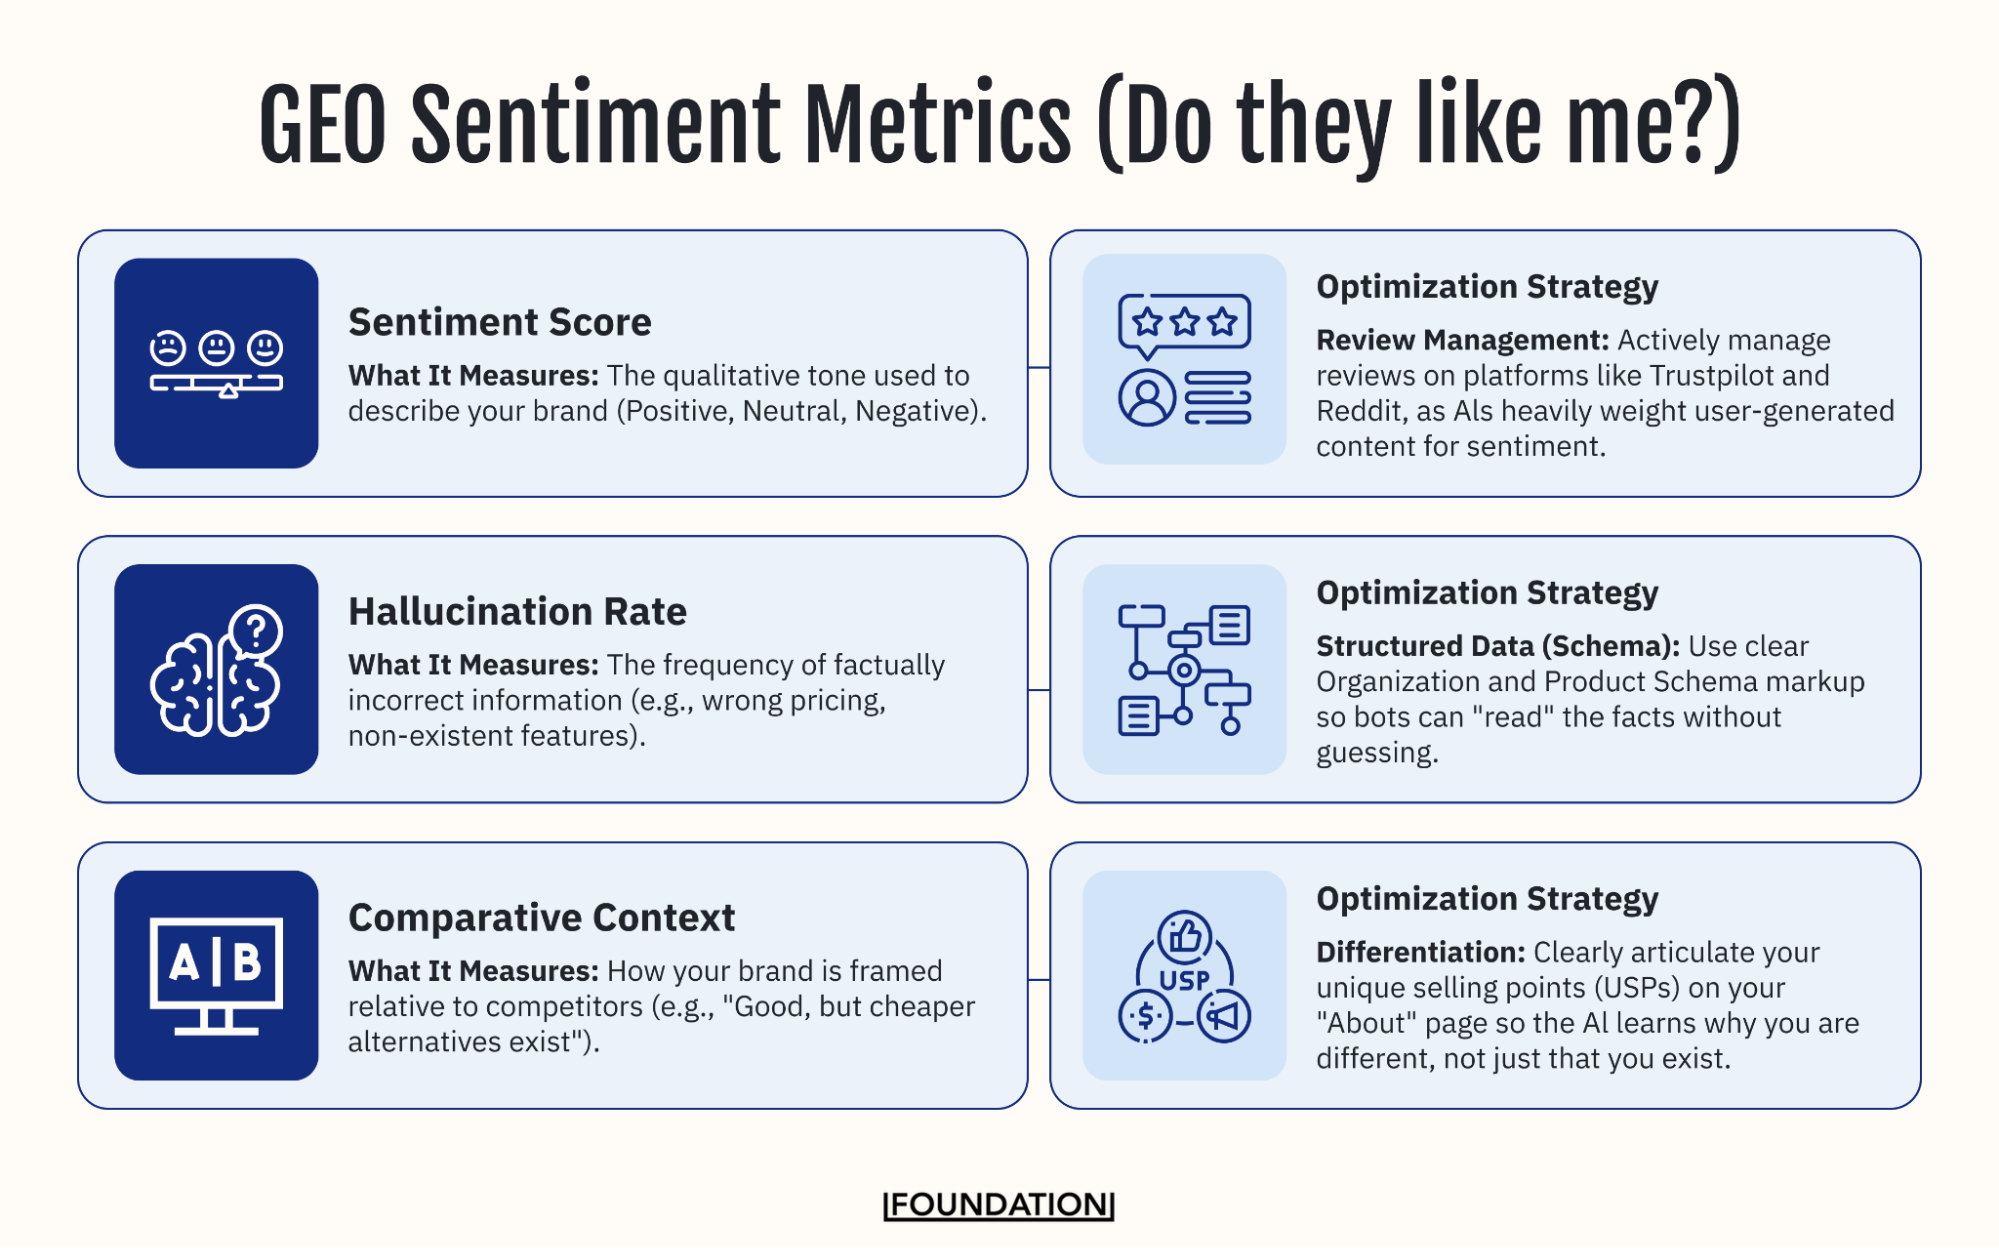
| Sentiment | Sentiment Score | The qualitative tone used to describe your brand (Positive, Neutral, Negative). | |
| Hallucination Rate | The frequency of factually incorrect information (e.g., wrong pricing, non-existent features). | ||
| Comparative Positioning | How your brand is framed relative to competitors (e.g., “Good, but cheaper alternatives exist”). | ||
Let’s take a look at each one, why it matters, how to track it, and what you can do to control it. But first, a note on how we at Foundation measure GEO metrics.
| How Foundation Tracks GEO Metrics:
Throughout this section, you’ll see examples from Profound, the AI visibility platform we use at Foundation to measure GEO performance alongside our internal methods. Profound automates the process of running prompts across AI platforms, tracking citations, and monitoring sentiment over time. In this case, we are using GEO metrics for the LegalTech brand Clio – an industry leader and brand with prominent AI visibility – to illustrate the different metrics. Other GEO tools like Otterly.AI, Semrush’s AI Toolkit, and manual audit methods can capture similar data — we’ll cover those options later. For now, understand that these metrics are trackable today with the right tooling and process. |
1) Visibility & Presence Metrics (Do They See Me?)
Visibility metrics answer the most fundamental question in GEO: when someone asks an AI about your category, does your brand even come up?
These metrics form the foundation of your measurement framework because, without visibility, nothing else matters. You can have perfect sentiment and strong citations, but if you don’t show up in the first place, those signals are irrelevant.
Let’s start with the new “share of” in town, as Tom Roach puts it.
Share of Model (SoM)
The most important shift in thinking here is that GEO visibility is about “Share of Model,” not just Share of Voice.
Share of Model tells you how often your brand appears in AI responses for a specific category prompt across one or more LLMs. This is the new market share. If you aren’t in the model’s consideration set, you don’t exist for that query.
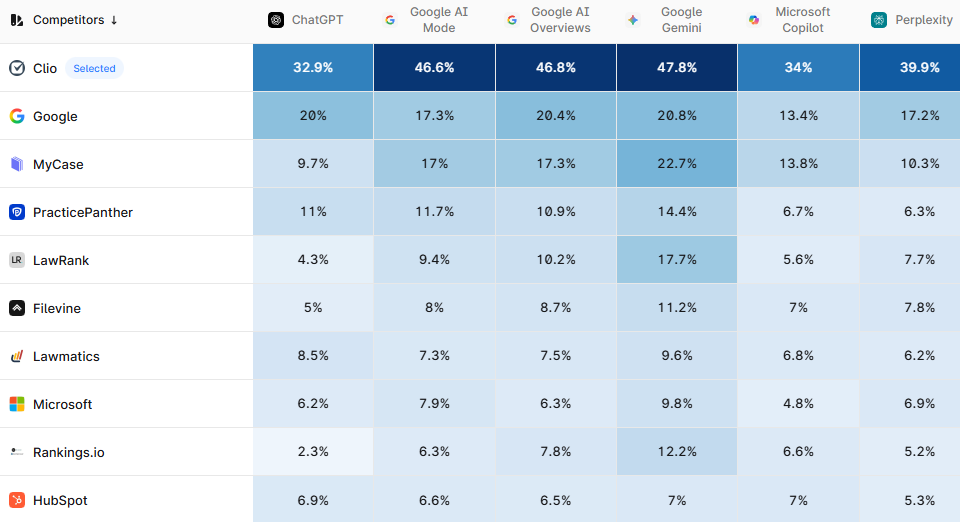
How to track it: Run your priority prompts across ChatGPT, Perplexity, Gemini, Google AI Overviews, and Copilot. Calculate the percentage of responses where your brand appears. Profound automates this across platforms. Clio’s dashboard shows visibility share ranging from 32.9% on ChatGPT to 47.8% on Gemini, with their nearest competitor MyCase at roughly half those numbers.
How to influence it: Ensure your brand name is structurally tied to relevant keywords and concepts across your site, press coverage, and third-party mentions. The more consistently AI encounters your brand in the context of your category, the more likely it is to recall you.
Generative Position
Generative position is similar to SERP rank, except it tracks your average position in AI answers. When ChatGPT produces a list of “the top 5 tools for X”, where does your brand appear? Is it the first one mentioned or do you have to scroll down?
Here’s why that position matters so much in GEO: When LLMs generate list responses, the first-mentioned brand typically gets direct-answer language — “X is widely considered the best option for…” — while later positions get relegated to “other options include” or “you might also consider.” That linguistic framing signals preference to users, even when the AI doesn’t explicitly rank.
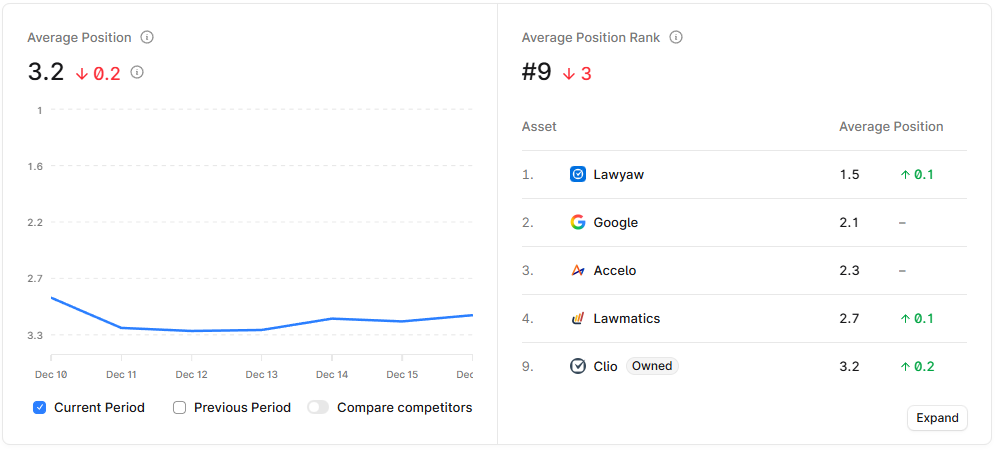
How to track it: Monitor your average position across AI-generated lists for your priority prompts. Profound shows Clio with an average position of 3.2 — meaning they’re mentioned behind at least two other brands across many queries, a surprising result given their Share of Model dominance.
How to influence it: Secure placements in comparative content, like “Best of” listicles, on high-authority sites. LLMs disproportionately cite comparative content — listicles alone account for roughly 30% of all citations. Ranking #1 on those lists significantly increases your chances of being surfaced first in AI answers.
Query Coverage
Query coverage measures whether your brand appears across the full range of buyer intents an AI uses to build its answers.
Showing up for “cheap CRM software” is not the same as showing up for “enterprise CRM for healthcare compliance.” Both are valuable, but they reflect different audiences and different stages of the buying journey.
The key complexity is this: the question a user types is rarely the only question the AI evaluates. When someone asks, “What’s the best project management tool for remote teams?”, the model expands that prompt into multiple related, high-intent queries to research an answer. This process, known as query fanout, determines which brands the AI ultimately surfaces.
How to track it:
- Select your priority prompts. Start with 15–20 questions tied to high-intent buyer moments — category queries, comparison queries, and “best of” questions where you want to show up.
- Map the fanouts. Use Profound’s fanout tracking (or run prompts manually and note the cited sources) to see what queries each prompt generates. For example, “What are the best-rated marketing firms for small legal practices?” fans out to variations across geographies (UK, US, Canada), temporal modifiers (2025), and restructured phrasing.
- Identify coverage gaps. Compare where you appear versus where competitors show up. The fanout queries where you’re absent but competitors aren’t? Those are your highest-leverage opportunities.
How to influence it: Create long-tail content addressing the specific fanout queries where you’re missing. This often means building out niche use-case pages, comparison content, and localized variations that train the model on your versatility across the full query set.
2) Citation & Trust Metrics (Do They Trust Me?)
Visibility gets you into the conversation. Citation metrics tell you whether the AI trusts you enough to back up claims with your content.
These metrics matter because citations are the bridge between zero-click environments and traffic. Given the more personalized experience of LLM interactions, when they cite your domain it’s like someone vouching for you as a credible source.
Citation Frequency
This metric tracks how often AI links to your website or explicitly names you as an information source. Perplexity, for example, shows users exactly where information it provides was sourced from.
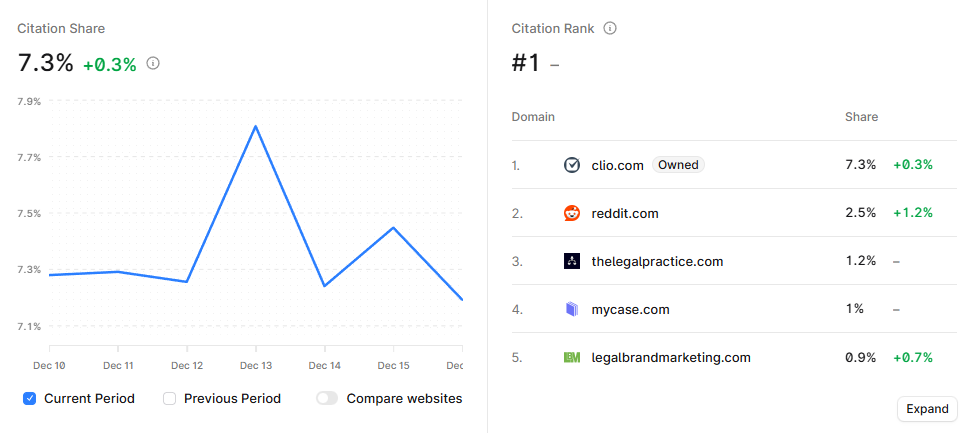
How to track it: Track citation frequency separately by platform, as Google AI Overviews, Perplexity, and ChatGPT each have different citation behaviors. Clio leads their industry with a 7.3% citation share — more than the next four domains combined.
How to influence it: Publish original data, whitepapers, or unique definitions that require a citation to validate. Quotable stats give the AI a reason to link back to you rather than paraphrasing without attribution.
Remember: AI models are constantly being tweaked to improve the user experience, which means you’ll see fluctuations in AI visibility across the board. Strategic adjustments are a must in this context, just ask Josh Blyskal:
Citation Drift
AI search engines are probabilistic, meaning they rarely generate the exact same answer twice. Instead of a fixed database, they predict the next best word, which leads to significant fluctuation in the sources they cite — even for identical questions.
Citation Drift measures this instability, tracking how frequently your brand’s coverage is swapped out for a competitor or dropped entirely as the model rotates through different data points.
How to track it: Run the same prompts multiple times across sessions and track how often your brand appears versus gets replaced. High variance indicates your presence is unstable.
How to influence it: Counteract volatility with source diversification. Ensure your brand is mentioned and linked-to across multiple high-authority domains — your own site, G2, tier-1 press, and niche forums. The more “winning tickets” you have in the pool, the higher the probability that AI will land on one of your sources, even as it drifts away from others.
Source Authority
When AI discusses your brand or your competitors, which sites is it citing as sources? Source authority involves identifying which third-party sources drive the most AI citations in your category, then prioritize securing presence on those URLs.
This matters because AI engines trust third-party validation more than brand self-claims. Being cited via a G2 review, a Forbes listicle, or an industry analyst report carries different weight than your own blog post.
How to track it: Track your source breakdown: own site versus G2/Capterra versus Reddit versus industry publications versus news outlets. Clio earned 400 citations across 188 pages on Perplexity — notably, many came from review sites rather than their own content.
How to influence it: Focus your digital PR on publications that already have high visibility in AI answers — major news outlets, reputable review sites, and industry analysts. Identify which third-party sources drive the most AI citations in your category, then prioritize securing presence on those URLs.
Thread Ownership (For Reddit and Communities)If your competitors are actively marketing on Reddit, you should be too. And you need to pay attention to the threads playing kingmaker on the platform. For community platforms like this, track how many priority discussions your brand authors or meaningfully participates in vs other brands in your category. Reddit threads are heavily cited by LLMs. But here’s the challenge: locked or archived threads mean competitors own that narrative permanently. You can’t add your voice to a conversation that’s been closed. One Foundation client in financial services moved from being mentioned in 12 of 100 priority Reddit threads to 73 over three months. Even more importantly, they appeared above competitors in 53 of those mentions. That’s not a marginal improvement — it’s a fundamental shift in how AI systems present their brand relative to the competition. |
Pillar 3: Sentiment & Brand Safety Metrics (Do They Like Me?)
Visibility and citations get you into AI responses. Sentiment determines whether that’s a good or a bad thing.
These metrics are your brand safety layer. Being mentioned frequently means nothing if the AI is telling users to avoid you. And in an environment where you can’t control the narrative directly, monitoring sentiment becomes essential.
Sentiment Score
Sentiment score measures whether AI describes your brand positively, neutrally, or negatively.
You can rank #1 in visibility but still lose if the AI says something like “Brand X is the most popular option, but users frequently complain about high prices and poor customer support.” That’s a toxic #1 ranking — visibility without positive sentiment can hurt more than help.
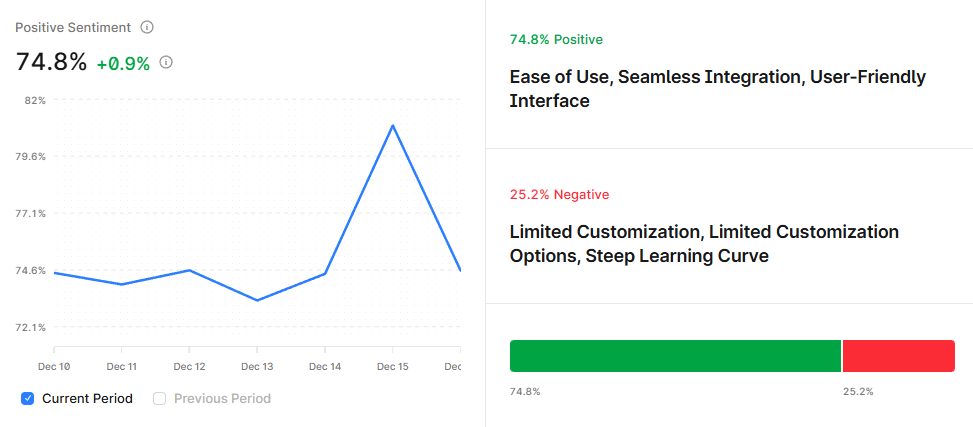
How to track it: Categorize mentions as positive, neutral, or negative and track trends over time. Clio’s sentiment analysis shows 74.8% positive mentions, with AI highlighting attributes like “Ease of Use” and “User-Friendly Interface.” The 25.2% negative mentions cluster around “Limited Customization” — specific, addressable feedback.
How to influence it: Actively manage reviews on platforms like Trustpilot and Reddit, as AIs heavily weight user-generated content for sentiment. A sudden shift toward negative sentiment is an early warning signal that something needs attention.
Hallucination Rate
Hallucination rate tracks how often AI states something factually incorrect about your brand. Wrong pricing. Discontinued products listed as current. Incorrect feature descriptions. Confusion with a competitor. These hallucinations happen, and they’re a brand safety crisis waiting to unfold.
How to track it: Maintain an accuracy monitoring log. Document all hallucinations with screenshots and enter the prompts into a spreadsheet for long term tracking (month-over-month, quarter-over-quarter, etc.).
How to influence it: Use clear Organization and Product Schema markup so bots can “read” the facts without guessing. Some inaccuracies can be corrected by updating your own content; others require influencing the third-party sources AI is drawing from.
Competitive Positioning
When both you and a competitor appear in the same response, who gets mentioned first? That’s competitive positioning.
The number in which you are positioned is very important to the response that the LLMs give. If you’re consistently following a competitor in AI responses, that’s how LLMs will articulate the relationship between your brands.
How to track it: Track your win/loss ratio on shared mentions. Identify specific queries where you consistently trail competitors.
How to influence it: Clearly articulate your unique selling points on your “About” page and throughout your content so the AI learns why you are different, not just that you exist. Prioritize the queries where you trail for optimization.
With the three pillars defined, the work becomes operational: building a repeatable way to measure GEO across platforms.
How to Operationalize GEO Measurement
There’s no single “Google Analytics for AI” yet, but the tooling landscape is evolving quickly.
The good news is you have options — from enterprise platforms that automate everything to manual approaches that work for any budget. The key is choosing a method that matches your resources and gives you the data you need to take action.
The Automated Route: GEO Tools
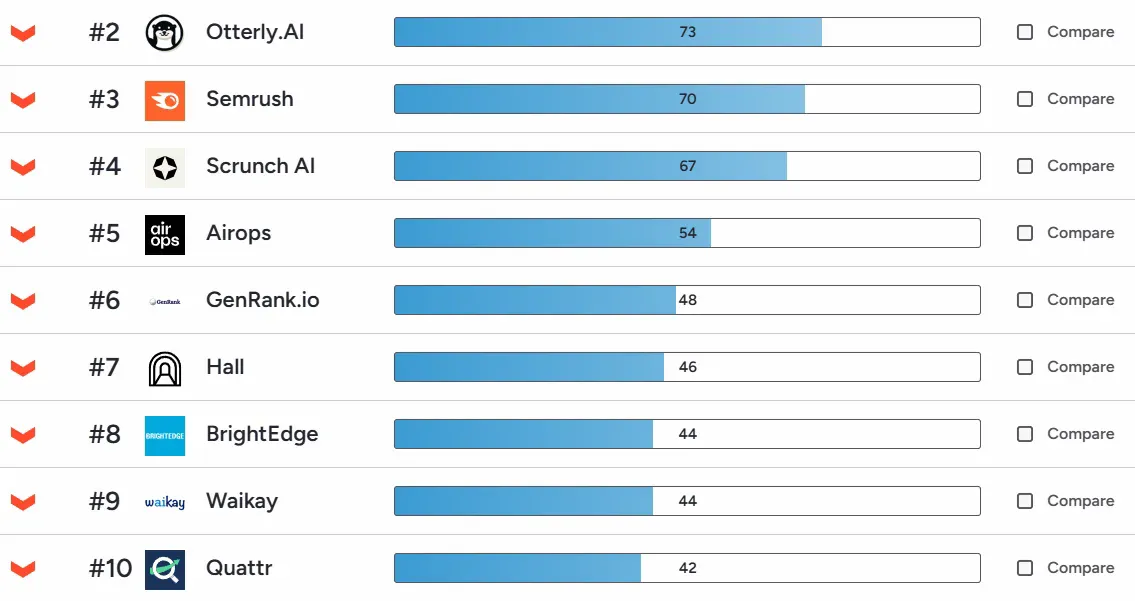
Several platforms have emerged to automate GEO tracking, and the category is maturing quickly. G2’s ranking of GEO tools shows the current landscape, with Otterly.AI (73), Semrush (70), and Scrunch AI (67) leading on user ratings, followed by Airops, GenRank.io, Hall, BrightEdge, Waikay, and Quattr rounding out the top 10.
Different tools serve different needs:
- Profound offers citation mapping, competitive share analysis, query fanout tracking, and the kind of dashboard views shown in the Clio examples throughout this piece.
- Otterly.AI focuses on AI search monitoring and brand tracking across LLMs.
- Airops and GenRank.io offer workflow automation and rank tracking for AI search.
SEO tools like Semrush, Ahrefs, and Moz are also joining the ranks of GEO tools, bringing their expertise in search engine tracking to the AI space.
The Manual Audit Method
For smaller brands, detailed baseline assessments, or even just to support the data from your GEO tools, our team takes a manual approach. Here’s the process we run for our clients using Profound:
- Define your “Golden Prompts” — the top 15–20 questions your customers actually ask AI tools. These differ from traditional keywords. They’re more conversational, more specific, and often include multiple criteria. Include bottom-of-funnel modifiers like “best,” “top,” “alternatives to [Competitor],” and “[Brand A] vs [Brand B].”
- Run the incognito test. Execute your prompts in ChatGPT, Gemini, Perplexity, and Claude using fresh instances to avoid personalization bias. Test non-branded category queries, not just searches that include your brand name.
- Build your scorecard. For each prompt, record: Did you appear? What position? What was the sentiment? What sources were cited? Was the information accurate?
The scorecard helps you see which prompts actually influence visibility and consideration, rather than treating every LLM mention as equally important. As your brand begins to appear more consistently in high-intent LLM responses, the impact becomes measurable, and the scorecard makes it clear where to focus next.
Use this simple prioritization framework to identify the prompts that matter most to you:
- High business value plus low AI visibility = immediate priority. These are your biggest opportunities.
- High traffic queries plus high visibility = maintain and update. Protect what’s working.
- Low traffic plus high visibility = analyze why. You might be winning queries that don’t matter.
- Low value plus low visibility = deprioritize. Not every battle is worth fighting.
Once you’ve selected your tools and methodology, the final piece is establishing a rhythm that keeps you informed without drowning you in data.
The Measurement Cadence
Different metrics require different rhythms. Some signals change weekly; others need months to evaluate meaningfully. Whether you’re just building out your GEO RFP or are well into planning, here’s what you need to know about measurement cadence:
- Weekly: Run visibility audits on your top 20 prompts across major AI platforms. Track appearances, positions, sentiment, and cited sources. This catches rapid changes and competitive movements.
- Monthly: Aggregate weekly data into visibility share trends. Analyze citation frequency and source breakdown. Document hallucination fixes and progress on “zeros to mentions” initiatives.
- Quarterly: Deep-dive on sentiment analysis and cross-platform presence. Update competitive benchmarks and adjust strategy based on what’s working.
- Biannually: Connect GEO metrics to business indicators — branded search trends, sales conversation themes, and win/loss patterns. This is where you build the case for continued investment.
The framework is straightforward. The discipline is showing up consistently and letting the data guide your priorities.
Start Measuring What Matters: Build Your GEO Strategy Today
The ROI of GEO is like the ROI of having a good reputation. You can’t calculate it precisely, but you’ll certainly feel its absence when competitors dominate the AI conversation about your category.
AI search isn’t slowing down. More buyers are starting their research in ChatGPT, Perplexity, and AI Overviews every month.
The brands that establish measurement frameworks now — tracking visibility, citations, and sentiment across platforms — will have the data they need to improve. The brands that wait will be playing catch-up against competitors who’ve already optimized their way into the default recommendation slot.
The three pillars give you a framework. The tools give you the data. The cadence gives you the rhythm.
What’s left is execution.
Ready to build your GEO measurement framework? Get in touch with the leading GEO agency to discuss how we can help you track and improve your AI visibility.
