Article's Content
Article's Content
You already know LinkedIn matters. What you probably don’t know is whether your LinkedIn investment is actually performing — or just present.
This piece exists to answer that question. It pulls together the most current data available on LinkedIn’s reach, search authority, advertising performance, and buyer behavior. The figures are drawn from LinkedIn and Ipsos’s 2025 B2B Marketing Benchmark, Dreamdata’s analysis of 220,000+ B2B customer journeys, and our own analysis of organic and web traffic using Ahrefs and SimilarWeb.
Use it as a benchmarking tool. Where are you over-indexed? Where are you leaving performance on the table?
One thing worth establishing up front: LinkedIn is not a small stage. The platform now has more than 1 billion members across 200 countries, and in February 2026 alone it received 1.822 billion visits at an average session duration of over seven minutes. Your buyers are there, they’re engaged, and they’re spending serious time.
1. LinkedIn’s Authority in Search and AI Discovery
The reach of LinkedIn as a B2B marketing channel doesn’t stop at the feed. It’s a major source of organic and AI search traffic. Every piece of content published natively on the platform carries the weight of one of the most authoritative domains on the internet, and that authority now extends directly into AI-generated answers across every major platform.
Here’s what Ahrefs Site Explorer and SimilarWeb Website Performance tools show about LinkedIn’s immense web presence:
Organic Search Authority
- LinkedIn holds a Domain Rating of 99 out of 100 — the highest score possible — meaning every page published on the platform carries maximum ranking potential in Google Search (Ahrefs)
- LinkedIn ranks for 14.4 million organic keywords globally, with 3.5 million pages ranking in the top three positions (Ahrefs)
- The platform generates an estimated 147 million monthly organic visits, representing $47.9 million in traffic value (Ahrefs)
- LinkedIn has accumulated 14.3 billion backlinks from 11.6 million referring domains, among the largest link profiles of any site on the internet (Ahrefs)
- LinkedIn Pulse (/pulse/) alone ranks for 1.3 million organic keywords and drives 4.2 million monthly organic visits worth an estimated $3 million in traffic value (Ahrefs)
- LinkedIn Posts (/posts/) ranks for a further 2.5 million organic keywords and generates 9.5 million monthly visits (Ahrefs)
AI Search Visibility
As AI-powered answers increasingly replace traditional search results, where your content lives matters as much as what it says. LinkedIn has emerged as one of the most cited sources across every major AI platform, a strong signal that thought leadership content published natively on LinkedIn carries significant weight in AI training and retrieval systems.

- LinkedIn content appears in 454,000 Google AI Overview citations across 274,000 pages, making it one of the most referenced professional sources in AI-generated search results (Ahrefs)
- ChatGPT references LinkedIn content in 350,000 instances across 230,000 pages (Ahrefs)
- Perplexity cites LinkedIn in 356,000 instances across 258,000 pages (Ahrefs)
- Microsoft Copilot references LinkedIn content across 66,300 citations (Ahrefs)
- LinkedIn Pulse content specifically is cited by ChatGPT 105,000 times and appears in 164,000 Google AI Overview results, indicating that long-form thought leadership published on LinkedIn has outsized AI discoverability relative to other content formats (Ahrefs)

Benchmark check: Pull up one of your recent LinkedIn articles or posts and search for it on Google. Does it rank? LinkedIn’s DR 99 domain authority means native content has a strong ranking advantage — but only if it’s structured to be found. If your LinkedIn content isn’t showing up in search results, the authority is there; the content strategy may not be.
2. Trust Is the New Growth Metric
A LinkedIn and Ipsos 2025 B2B Marketing Benchmark surveyed 1,500 senior- and executive-level marketers across six countries to uncover how trust impacts. Its central finding is both simple and strategically consequential: trust is no longer a soft brand outcome. It’s the primary driver of B2B commercial performance.
The following data from that report, combined with Dreamdata’s analysis of over 220,000 customer journeys, makes the case for why LinkedIn is the right platform to build it.
- 94% of B2B marketers agree that building trust is the most important factor for achieving B2B brand success (LinkedIn/Ipsos 2025)
- 42% of senior marketers rank increasing brand awareness and reputation among decision-makers as their single top business priority, more than any other goal surveyed (LinkedIn/Ipsos 2025)
- 70% of the average B2B customer journey happens before a prospect engages with sales at all, meaning marketing owns the majority of the path to revenue (Dreamdata)
- The average B2B customer journey spans 211 days from first touch to closed-won revenue, and can exceed 12 months for complex enterprise deals (Dreamdata)
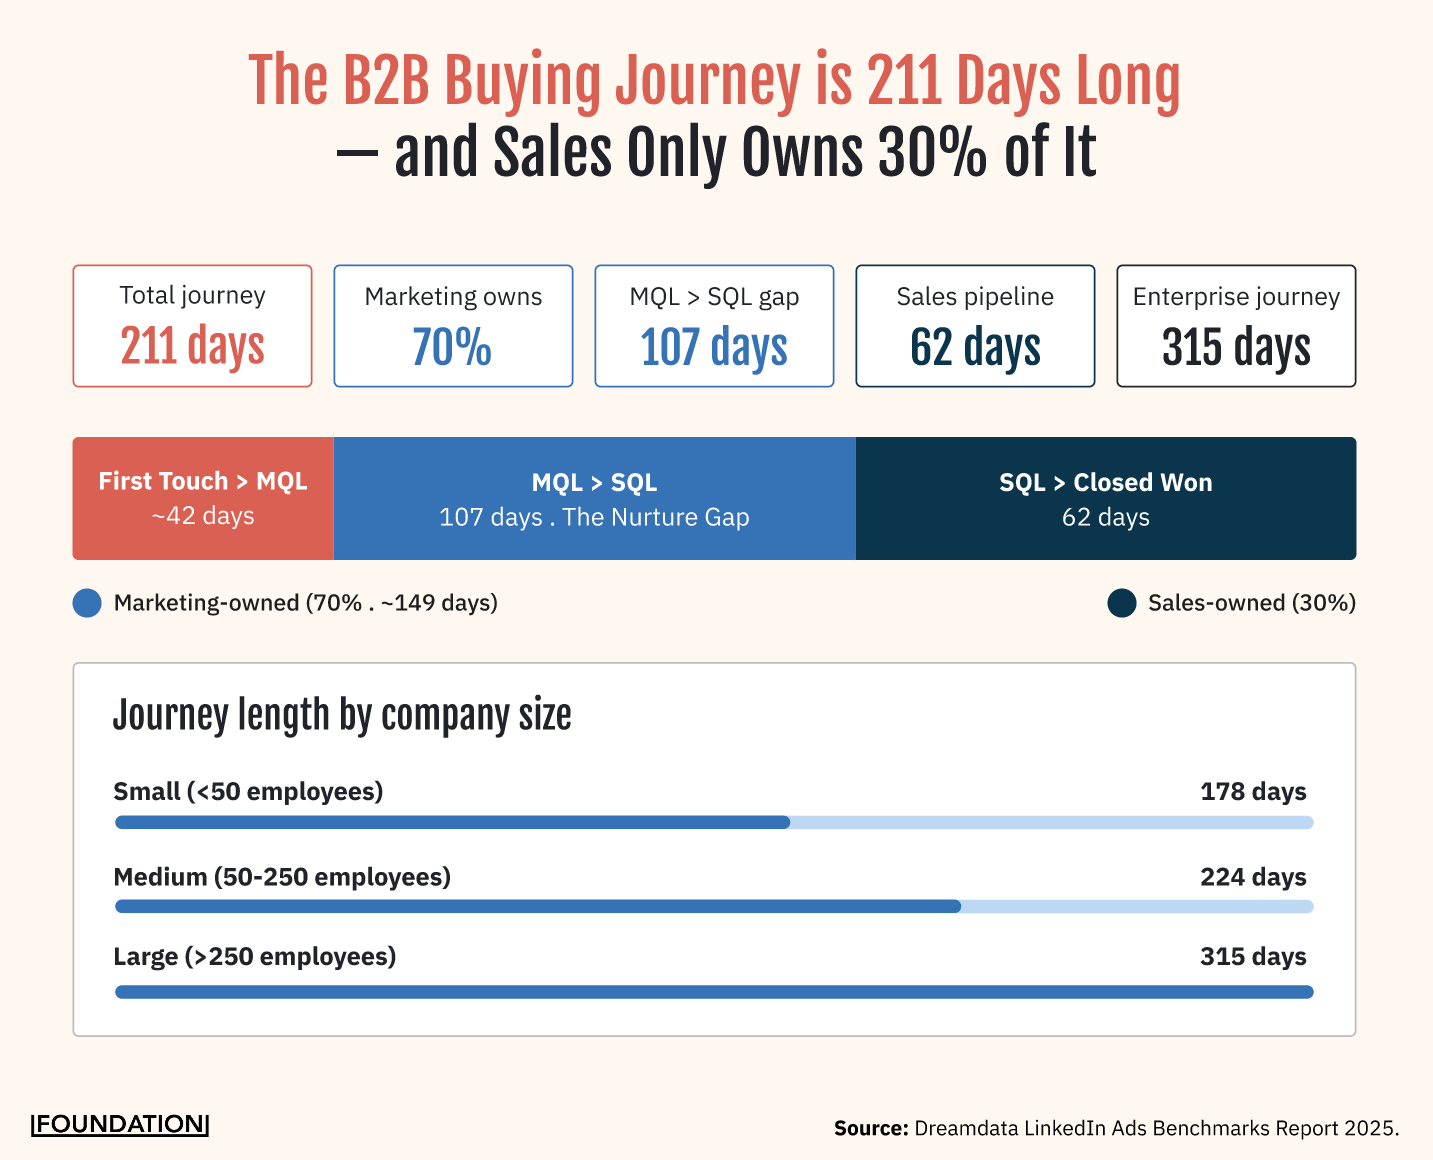
- The typical journey involves 6.8 buyer stakeholders, 3.7 channels, and 76 individual touchpoints, a level of complexity no single channel or campaign can address alone (Dreamdata)
- The single biggest bottleneck in the B2B funnel is the 107 days between MQL and SQL, a period where marketing is solely responsible for keeping prospects warm and moving them toward a sales conversation (Dreamdata)
- For large enterprise targets with more than 250 employees, the MQL-to-SQL gap stretches 75% longer than for smaller companies, making sustained nurturing even more critical at the top end of the market (Dreamdata)
Benchmark check: What is the gap between MQL and SQL in your current pipeline? The B2B average is 107 days. If yours is significantly longer, the data suggests the bottleneck is in marketing’s nurture phase — not sales. If yours is shorter, you may be advancing leads before they’re genuinely ready, which shows up later as poor close rates. Either way, this number is worth pulling from your CRM this week.
3. Video and Influencer Marketing: LinkedIn’s Fastest-Growing Advantage
For the past several years, video content has been described as a growing priority in B2B marketing. In 2025, it graduated from priority to prerequisite.
The 2025 LinkedIn/Ipsos Benchmark also revealed some interesting insights about media preferences. Specifically, brands investing in video and creator partnerships are the ones pulling ahead. Another LinkedIn report from their Creative Lab shows how brands can tell more compelling stories with Video.
The performance gaps between users and non-users of these formats are now large enough to be strategically decisive.
Video
- 78% of B2B marketers already use video in their marketing mix; 56% plan to increase video output in the next year (LinkedIn/Ipsos 2025)
- Short-form social video delivers the highest ROI according to 41% of marketers, followed by brand storytelling at 38% and testimonials and product demos at 34% (LinkedIn/Ipsos 2025)
- The top three goals for B2B video are increasing brand awareness (35%), building trust and credibility (29%), and driving conversions or sales (23%) (LinkedIn/Ipsos 2025)
- LinkedIn saw a 12% year-over-year increase in B2B advertisers using video on the platform, a 34% increase in video completions, and a 3.8 point rise in view-through rate (LinkedIn Creative Labs)
- Emotionally resonant video generates 44% higher view-through rate and 2x the completion rate versus standard video (LinkedIn Creative Labs)
- Video versus static ad formats produces a 26% lift in brand favorability and a 19% lift in purchase intent (LinkedIn Creative Labs)
- Short-form video delivers a 17% lift in completion rate versus longer formats (LinkedIn Creative Labs)
The data makes the case for video investment. But knowing how to use it effectively to grow your LinkedIn following or generate leads is a different challenge. Ross Simmonds, founder and CEO of Foundation, who has generated over $2 million in direct revenue from LinkedIn in a single year, breaks down his seven-strategy framework for turning LinkedIn into a consistent lead generation channel, with video at the center of it.
Influencer and Creator Marketing
- 55% of B2B marketers currently use influencer or creator marketing; another 29% plan to adopt it within the next year (LinkedIn/Ipsos 2025)
- 76% of marketing leaders believe collaborating with creators builds brand authenticity (LinkedIn/Ipsos 2025)
- Brands using influencer marketing outperform non-users by up to 39% on customer engagement and brand awareness, and by 30% on revenue growth and lead generation (LinkedIn/Ipsos 2025)
- The top criteria for selecting B2B creators are authenticity and credibility (58%), followed by industry relevance (49%), brand alignment (47%), and subject matter expertise (47%) (LinkedIn/Ipsos 2025)
- Thought leaders and industry analysts are rated the most effective influencer type by 28% of marketers, followed by company customers at 23% and independent creators at 20% (LinkedIn/Ipsos 2025)
- 71% of marketers say being recommended by a subject matter expert influencer is influential in building a successful B2B brand (LinkedIn/Ipsos 2025)
- Thought Leader Ads achieve up to 2.3x higher click-through rate than standard single-image ads with the same objective, because they look and feel like organic posts rather than paid placements (Dreamdata)
Benchmark check: 78% of B2B marketers are creating video content, and 55% are using creator or influencer partnerships. If you’re not in both camps yet, you’re now in the minority — and the performance gap between users and non-users is wide enough to affect pipeline outcomes. A simple starting question: how many of your last ten LinkedIn posts included video? If the answer is fewer than three, there’s an immediate gap to close.
4. LinkedIn Advertising: The ROI Case
LinkedIn Ads have a reputation for being expensive. That reputation is often based on surface metrics, cost per click and cost per impression, that were designed for B2C buying contexts and don’t always reflect how the B2B buyer journey actually works.
When measured against the metrics that matter in B2B, company-level influence, pipeline impact, and closed revenue, LinkedIn is among the most impactful. According to Dreamdata’s comparison , it’s arguably the strongest performing paid channel available for B2B brands.
Budget Trends
- LinkedIn Ads now represent 39% of the average B2B ad budget, up from 31% in the first half of 2024, making it the single largest individual ad channel allocation (Dreamdata)
- The Google Network captures 48% of total B2B ad budget in aggregate, but when broken down by individual sub-channel (Search, Display, YouTube, Smart), LinkedIn is the single largest channel by spend (Dreamdata)
- Meta receives just 8% of the average B2B ad budget, reflecting the platform’s limited ability to generate business-relevant outcomes despite its lower surface cost metrics (Dreamdata)
Return on Ad Spend vs. Competing Channels
- LinkedIn Ads generate a 113% ROAS, making it the only major ad network to produce a positive return on investment when measured against closed-won revenue over a 12-month period (Dreamdata)
- Google Search Ads produce a 78% ROAS; Meta Ads produce 29%. Every dollar spent on Meta returns less than a third of what LinkedIn returns (Dreamdata)
- LinkedIn offers the lowest cost per company influenced, with a 45% cost advantage over Google Search and 94% advantage over Meta (Dreamdata)

- LinkedIn Ads influence 29% of all MQLs, 36% of all SQLs, and 35% of all new business deals in the average B2B pipeline (Dreamdata)
- For the top quartile of LinkedIn Ads users, those influence figures jump to 48% of MQLs, 53% of SQLs, and 53% of new business deals (Dreamdata)
- LinkedIn Ads account for 30% of all sessions at the MQL stage of the customer journey, the highest contribution of any paid channel at the top of the funnel. It declines to 28% at SQL and 15% at new business, reflecting LinkedIn’s primary role as a demand creation rather than demand capture channel (Dreamdata)

The Measurement Gap
One of the most important findings from the Dreamdata analysis is not about LinkedIn’s performance, it’s about how most marketers are measuring it. Or, more accurately, whether they are correctly diagnosing paid media challenges.The gap between LinkedIn’s apparent cost and its actual return is largely a measurement problem, not a performance problem.
- When LinkedIn Ads engagement data, including video views, likes, comments, and clicks, is factored into attribution modeling, measured ROI increases by 7.7x, suggesting most B2B brands are significantly undervaluing the channel (Dreamdata)
- The average time from a first LinkedIn Ad impression to closed revenue is 320 days.That’s longer than the overall B2B average of 211 days, not because LinkedIn is slow, but because it operates at the very top of the funnel, reaching buyers long before they enter an active buying cycle (Dreamdata)
- First ad engagement shortens that gap to 235 days; first ad conversion shortens it to 219 days, indicating that engagement-focused creative meaningfully accelerates time to revenue (Dreamdata)
- 95% of B2B buyers are out of market at any given moment, but they will be in the future. Consistent LinkedIn Ads presence ensures your brand is already on the shortlist when they are ready to buy (LinkedIn/Ehrenberg-Bass Institute)
LinkedIn Conversions API (CAPI)
- 75% of Dreamdata customers running LinkedIn Ads have now integrated LinkedIn’s Conversions API, a strong indicator of the channel’s growing maturity among sophisticated B2B advertisers (Dreamdata)
- CAPI users see an average 20% reduction in cost-per-action and a 31% increase in attributed conversions, achieved by feeding pipeline and revenue data back to LinkedIn for campaign optimization (LinkedIn internal data)
- 64% of CAPI users are optimizing toward pipeline and revenue conversions, prioritizing the downstream signals that most accurately represent B2B commercial outcomes (Dreamdata)
Benchmark check: Three numbers worth pulling from your own campaign data and comparing directly against the benchmarks in this piece.
- What percentage of your total ad budget is currently allocated to LinkedIn? The B2B average is 39%.
- What is your cost per company influenced — not cost per click, but cost per account that has had at least one touchpoint with your ads? The LinkedIn benchmark is €154.
- What ROAS are you measuring against closed-won revenue over a 12-month window? The benchmark is 113%.
If you don’t currently have visibility into the second or third number, that is the finding — and it points directly to an attribution gap rather than a performance gap.
Turn Your LinkedIn Presence into Pipeline
The data in this piece gives you specific numbers to measure against: 39% of ad budget on LinkedIn, 113% ROAS, 211-day buyer journeys, 107-day MQL-to-SQL gaps, 29% of MQLs influenced by paid.
If your numbers are close, you’re keeping pace. If they’re not, you now know where the gaps are.
The brands pulling ahead are treating LinkedIn as a full-funnel channel, investing in native publishing, video, creator partnerships, and paid amplification as reinforcing parts of a single strategy.
If you want help closing those gaps, that’s what we do. Foundation is the top social media marketing agency for B2B, helping brands turn LinkedIn into a consistent pipeline channel through content, distribution, and paid strategy.