
Article's Content
Article's Content
The average B2B company now pays $70 for a single lead from Google Ads — up 69% in four years. Cost per click is rising across 87% of industries.
As costs climb, the margin of error is shrinking.
Yet when performance drops, most marketing leaders hear the same thing from their paid team: “We’re testing some changes.” But testing without diagnosis is just organized guessing.
Foundation’s Strategy Director, Ben Dankiw, has spent 15 years in paid media watching teams burn budget on the wrong fixes. His solution is a three-zone diagnostic framework that separates campaign performance into creative, landing page, and post-click — each with its own signal metrics and corrective actions.
Before you rewrite another ad or rebuild another page, you need to know what’s actually broken.
Why Random Optimization Is Killing Your Ad Budget
Five years ago, a paid media team spent its mornings pulling search query reports, mining audience data, and manually reconciling performance across platforms. Those days are over.
Google’s Performance Max and Meta’s Andromeda updates now handle much of that optimization, provided you feed them the right data and creative.
But automation has created a false sense of control. When performance drops, teams default to the levers they recognize: bid adjustments, audience swaps, budget increases.
Those are all in-platform moves.
And in-platform moves can only solve in-platform problems.
Paid media performance is a three-link chain:
- Ad Creative: What earns attention — hook, headline, value proposition, format, and audience-message fit.
- Landing Pages: The post-click experience that can turn a click into a lead — through message match, offer strength, form design, and mobile usability.
- Post-Click Sequence: What happens after the form fill — nurture, speed-to-lead, lead scoring, and the feedback loop that tells platforms which leads actually convert.
Break one, and the whole system suffers.
Creative has to earn the click. The landing page has to convert. And even a high-converting page is useless if the leads it generates never close.
“When a campaign underperforms, most teams start changing everything at once — new headlines, different audiences, higher bids. But if your creative is strong and your landing page is broken, no amount of bid optimization will save you. You have to diagnose before you treat.” – Ben Dankiw, Strategy Director at Foundation.
The risk is misdiagnosis based on the wrong metric.
Dreamdata’s 2025 LinkedIn Ads Benchmarks Report show that while Meta clicks cost less than LinkedIn, LinkedIn ultimately drives stronger return on ad spend. Teams that diagnose at the click level shift budget toward cheaper traffic — and away from revenue.
That’s what happens when teams diagnose at the creative level and make budget decisions based on click costs. They see cheaper clicks on Meta and shift spend. But the real issue, or opportunity, can sit later in the chain, where you measure what turns into pipeline and revenue.
Without a framework that covers all three components, this team would have scaled the platform producing the least pipeline. The clicks looked efficient. They just did not close.

Ben calls it a “forest for the trees” issue. Teams get locked onto platform mechanics and lose sight of what actually drives outcomes. “If you only know Google Ads, you’re covering maybe 30 to 40 percent of what actually drives results,” he says. “The other 60 to 70 percent is creative strategy, landing page optimization, and what happens after someone converts. That’s where most campaigns are won or lost. But it’s also what most paid media specialists were never trained in.”
That’s why this framework matters. It forces you to examine each stage independently before you start changing anything.
The Three Pillars of Paid Media Diagnostics
The framework for paid media optimization is a sequential diagnostic. That means you start at the first pillar and work your way forward. Each pillar answers one question:
- Creative: Are people clicking?
- Landing Page: Are they converting?
- Post-Click Sequence: Are leads becoming revenue?

Each pillar has one signal metric and a defined set of fixes.
The order matters. If ad creative is the bottleneck, there’s no point auditing your landing page because the traffic isn’t getting there. If your creative and landing pages are healthy, the problem is downstream in the post-click experience, where most ad platforms have zero visibility.
Experienced teams may review multiple signals at once. But the diagnosis still follows the same logic: identify the primary constraint, then fix it.
The framework exists to enforce that discipline — so teams don’t optimize by instinct or change everything at once.
1) Creative – “Are People Clicking?”
The Leading Metric: CTR
Evaluate CTR relative to your own historical performance, campaign intent, and channel context. A branded search campaign and a cold prospecting campaign on Meta will have very different baselines. What matters is whether the CTR is trending in the right direction for your situation — and whether it’s strong enough to drive sufficient traffic downstream.
If CTR consistently falls below what you’d expect for the channel and audience, creative is likely the bottleneck. People are seeing your ad and choosing not to click.
What’s Driving This
According to WordStream’s Google Ads benchmark report, overall CTR across increased just 3.74% year over year, and 52% of industries saw flat or declining click-through rates.
After two years of growth driven largely by platform-level ad placement optimization, those gains have plateaued.
At the same time, 63% of marketers say they need more unique, human-centred content to stand out, and 53% struggle to differentiate in an AI-saturated market (HubSpot). When everyone uses the same AI tools and prompts, the output looks the same.
Creative quality is becoming the primary lever.
The 6 Gut-Check Diagnostic Questions to Ask
“Creative” in this context isn’t just the image or video. It’s the hook, headline, value proposition, format and audience-message match. Strong creative shown to the wrong audience will still produce weak CTR.
If performance is below baseline, break the ad down:
- Is the hook strong enough to stop the scroll? You have less than a second on most platforms.
- Is the visual distinctive or does it blend into the feed? If it doesn’t earn a pause, the copy won’t get read.
- Does the message speak to the right pain point for this audience segment? A message that resonates with enterprise buyers might fall flat with mid-market teams.
- Is the format aligned with platform norms? What performs on Meta may not work on Reddit or LinkedIn.
- Is the offer immediately clear? If a viewer has to infer value, they’ll scroll past.
- Are you running enough variations, or have the same assets been in rotation for months? Creative fatigue is real. Watch for declining CTR over time with stable targeting, rising CPC, increasing ad frequency, and falling engagement rates.
What to Fix
Ben recommends starting with competitive research.
The Facebook Ad Library and Google Ads Transparency Center show which ads competitors are actively running. His rule of thumb is: if an ad has been live for more than a month, it’s probably performing and worth studying.
Using this method, you can see around 2,000 HubSpot ads that have run since the start of the year across all Google formats.

What matters isn’t the volume. It’s the patterns.
Look for:
- Repeated value propositions
- Consistent offers
- Recurring creative formats
- Hooks that appear across multiple variations
When a brand runs hundreds or thousands of ads, but certain themes persist, that’s a signal. Those messages are likely converting.
The goal is to reverse-engineer what the market is responding to.
From there, isolate variables. Ask: Which specific element is underperforming, and what should we test next?
Change one thing at a time — the hook, the visual, the offer framing, the format — and measure impact before adjusting another input.
One caveat: low volume can distort your diagnosis. If a campaign generates fewer than 30 to 50 conversion events per month, instability may reflect insufficient learning data, not weak creative. Without enough signal, bidding fluctuates and performance appears erratic.
Before concluding creative is the issue, confirm the algorithm has enough data to learn.
| The Pillar 1 takeaway: Creative diagnosis is about isolating variables. Test one element at a time, watch for fatigue signals, and make sure you have enough data before drawing conclusions. |
Pillar 2: Landing Page – “Are They Converting?”
The Signal Metric: Conversion Rate
If CTR is healthy but conversions are low, the constraint has shifted to the page.
The signal metric for Pillar 2 is landing page conversion rate (CVR). If the page is converting below your baseline or industry benchmark (e.g., ~1% of ad traffic), something structural is likely wrong.
What’s Driving This
Teams investing in landing page optimization are pulling ahead. WordStream reports conversion rates improved for 65% of industries in 2025, with overall CVR up 6.84% year over year after prior declines.
As Cliff Sizemore, Senior Marketing Manager at LocaliQ, puts it: “Costs are rising, but so is performance.” “A smart strategy beats cheap clicks.”
The gap between optimized and unoptimized teams is widening. And much of that gap comes down to personalization. HubSpot reports that while 93% of marketers say personalization improves leads or purchases, only 13% hyper-personalize using behavioural or lookalike data.
This is where PPC-only specialists tend to hit a wall. The problem is no longer inside the ad platform, and diagnosing it requires a different skill set entirely.
The 5 Gut-Check Diagnostic Questions to Ask
The most common failure point is message mismatch: the promise in the ad doesn’t align with what the visitor finds on the page. An ad offering a free audit that leads to a “book a demo” page will bleed conversions no matter how strong the targeting.
Beyond message alignment, ask:
- Is the pricing or offer competitive for this market? Sometimes the page design is fine, but the value proposition is not.
- Is the form creating unnecessary friction? Too many fields reduce intent.
- Is there a single, clear action, or multiple competing paths? Every secondary CTA dilutes conversion.
- Does the page perform as well on mobile as on desktop? This is one of the most common and overlooked conversion killers.
- Is there intent mismatch between targeting and offer? A bottom-of-funnel page will not convert top-of-funnel traffic.
Sometimes it’s not the page that’s weak, it’s the audience landing on it that’s the issue.
What to Fix
A free trial, a demo request, and a content download will convert at very different rates. The right choice depends on funnel stage and intent.
Diagnosing landing page performance requires CRO expertise. The best teams build it in-house or partner with specialists.
You can’t diagnose a landing page problem from inside Google Ads.
| The Pillar 2 takeaway: Most conversion problems stem from intent or messaging misalignment — not bad design. Before you rebuild a page, confirm the right audience is arriving, and the offer matches what they were promised. |
Pillar 3: Post-Click Sequence – “Are Leads Becoming Revenue?”
The Signal Metric: Lead-to-Sale Conversion
This is the pillar most paid media teams overlook — and it’s often the one that determines profitability.
If CTR is strong and the landing page is converting, but pipeline isn’t growing, or deals aren’t closing, the problem lives outside the ad platform. The signal metrics are lead-to-sale conversion rates: MQL-to-SQL, SQL-to-close, and cost per acquisition relative to lifetime value.
The 4 Gut-Check Diagnostic Questions to Ask
Pillar 3 focuses on what happens after someone fills out a form:
- Is there an automated nurture sequence, or do leads sit untouched in a CRM? Paid leads lose their intent advantage quickly.
- How fast is sales follow-up? The difference between a 5-minute and a 5-hour response time can be the difference between a conversation and a dead lead.
- Is the nurture aligned with the specific offer they converted on? A research download requires a different follow-up than a pricing request.
- Are you scoring leads properly? A $100K opportunity and a $10K deal should not be treated the same.
The Surface Metrics Trap
The unlock in Pillar 3 is about closing the data loop back to the ad platform.
Here’s what happens when you only look at surface metrics:
Dreamdata’s benchmarks show that LinkedIn’s cost per individual contact is 145% higher than Meta’s and 100% higher than Google’s. At first glance, LinkedIn looks like the worst deal.
But across the full funnel, LinkedIn influences 29% of MQLs, 36% of SQLs, and 35% of new business deals.
Meta, by comparison, influences 4% of MQLs, 3% of SQLs, and 2% of new business.
LinkedIn is the only major B2B ad network generating a positive return on ad spend — 113% — compared to Google Search at 78% and Meta at 29%.
Among top-quartile LinkedIn spenders, the platform influences between 48% and 53% of all deals.
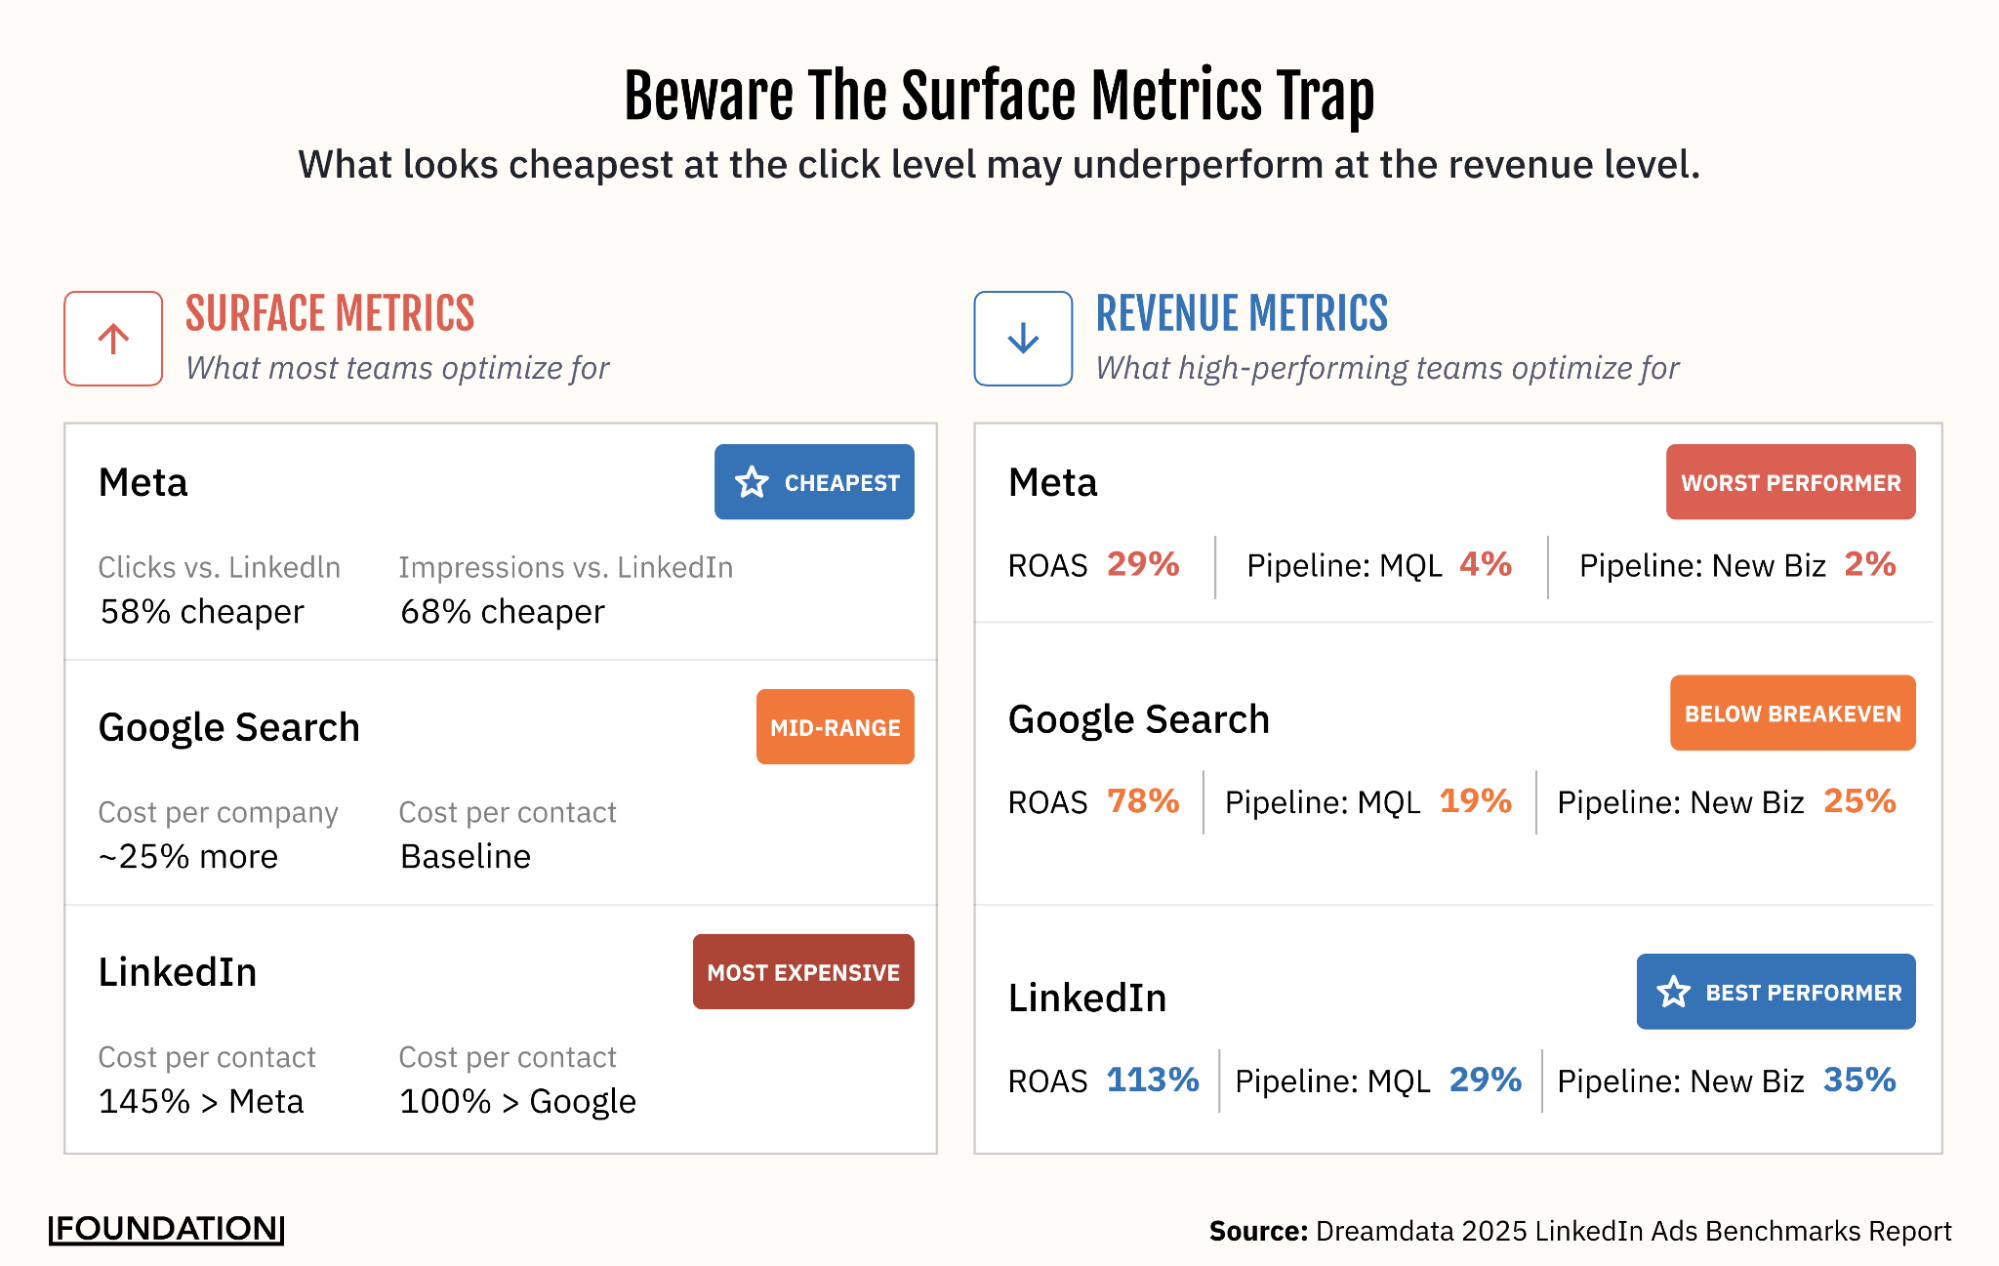
The cheaper clicks didn’t convert to pipeline. The expensive ones did. And you’ll only see that if you measure through to closed-won revenue.
What to Fix:
Ben emphasizes first-party data architecture— tracking, tagging, and CRM integration that connects an ad click to revenue. It’s how you tell the ad platform not just that someone filled out a form, but whether that person became a $5K deal or a $50K deal, and how long it took.
When you feed the ad platform accurate offline conversion data like revenue values, lead quality scores, and closed-won signals, the algorithm can optimize toward outcomes that matter.
Server-side tracking, enhanced conversions, and offline conversion imports close the loop between an ad click and revenue. Without that data, you optimize toward volume instead of value.
When Pillar 3 is working, you can run campaigns on target ROAS, feed profitability margins into your bidding, and let the algorithm find more of the leads that actually generate revenue.
HubSpot’s data reinforces this shift: marketers prioritize lead quality and MQLs (39%), lead-to-customer conversion rates (34%), and return on marketing investment (31%). These are all Pillar 3 metrics.
| The Pillar 3 takeaway: Don’t stop at fixing the post-click experience. Close the data loop so the platform optimizes for revenue, not just leads. |
Putting It Together: The Diagnostic Sequence in Practice
The framework works best as a repeatable process.
When paid performance starts to slip, run the same checks in the same order so you diagnose the constraint before you start applying fixes.
Start with Step 0. If measurement is wrong, every conclusion that follows will also be wrong.
Check 0 – Validate Your Measurement
Before you diagnose creative, landing page, or post-click issues, confirm the numbers you’re using are real.
This step gets skipped more often than it should. Incorrect tracking, broken conversion events, duplicate events, attribution gaps, or CRM sync issues can make healthy campaigns appear underperforming.
Run a quick validation:
- Are conversion events firing correctly and not duplicating?
- Does the data in your ad platform match what you see in your analytics and CRM?
- Are attribution windows set appropriately with your sales cycle?
- Has anything changed recently in your tag management or tracking setup?
Many apparent performance problems originate from measurement errors rather than campaign structure. Ruling this out first saves you from solving a problem that doesn’t exist.
Once measurement is validated, run the sequence.
Check 1 – Creative
Pull CTR across campaigns and ad groups. Compare against platform and industry benchmarks. If CTR is below threshold, you’ve found the bottleneck.
Focus everything on creative: audit your hooks, test new formats, study competitors’ long-running ads, and isolate which variables are underperforming. Don’t touch anything else until this is fixed.
Check 2 – Landing Page
If CTR looks healthy, check landing page conversion rates. Segment by campaign to see whether certain traffic sources convert better than others. If conversion rate is below benchmark, it’s a page problem.
Audit message fit between your ads and your pages, review form friction, test different offers, check mobile experience.
Check 3 – Post-Click
If both CTR and conversion rate are healthy, open your CRM. Look at lead-to-close rates, average time to conversion, and which campaigns produce leads that actually become revenue. If leads are stalling in the pipeline, it’s a Pillar 3 problem.
Audit your nurture sequences, evaluate speed-to-lead, review your scoring model, and check whether offline conversion data is flowing back to the ad platform.

How Long Should Each Check Take?
Rushing a diagnosis based on too little data is as costly as not diagnosing at all. Each pillar needs enough signal before you can draw reliable conclusions.
| Diagnostic Area | Minimum Evaluation Window |
| Creative tests | 7–14 days |
| Landing page tests | 200–500 clicks minimum |
| Pipeline evaluations | 30–90 days |
Give each pillar enough room to generate a clear signal before concluding it’s the bottleneck.
Build the System, Then Measure What Matters
The bottleneck will move.
You might fix creative and discover the constraint has shifted to your landing page. That’s not failure. That’s how a healthy system behaves.
The teams winning at paid media aren’t the ones with the biggest budgets. They’re the ones who understand where the constraint lives at any given moment and have the discipline to diagnose before they act.
Follow the sequence, validate the data, and fix the right constraint first.
Need help diagnosing your paid media performance? Contact Foundation’s paid media team to find out where your funnel is breaking — and what to fix first.
