



Article's Content
Article's Content
Across ChatGPT, Google AI Mode, and Google AI Overviews, YouTube is mainly a Google opportunity: 36% of Google AI answers cite YouTube, compared with 2.1% of ChatGPT answers. Many of the most-cited videos also come from small channels with titles that match buying questions.
The most-cited YouTube video in our dataset appeared in 291 AI answers. When we checked it, it had 3,671 views and came from a channel with 3,560 subscribers.
Broad claims about YouTube as a top AI source don’t tell a B2B marketing team where to focus. They usually blend engines, industries and methods, which hides the differences that matter for a generative engine optimization (GEO) plan.
Before you commit months of production time to video, you need to know which engines and which buying questions pull YouTube into their answers.
Our YouTube AI search research breaks down those differences, along with the traits that frequently cited videos share, so you have a grounded starting point for your next upload. For the execution details, see our guide to optimizing your YouTube channel for AI visibility.
Key Takeaways
- Of the three engines we track, 98.2% of YouTube citations come from Google AI Mode and AI Overviews.
- Google AI Mode and AI Overviews cited YouTube in 36.0% of answers, compared with 2.1% on ChatGPT.
- Among the 150 most-cited videos, views and subscriber counts had almost no link with citation frequency.
- “Best” or “top” appeared in 59% of usable titles from the top-100 group, compared with 10% in the cited-once sample.
- About half of Google’s YouTube video citations included timestamps, and about 71% of those pointed within the first five minutes.
- More than half of the 17,780 cited videos appeared in just one answer.
- Videos appearing in at least five weekly runs accounted for 66.4% of video appearances.
Methodology: How We Measured YouTube’s Role in AI Answers
Foundation’s B2B Citation Index, powered by Writesonic, tested the same 5,000 bottom-of-funnel B2B software prompts across 80 categories in 13 weekly runs between 29 June and 21 September 2026. All prompts ran in the US with search on.
Across ChatGPT, Google AI Mode, and Google AI Overviews, we captured 182,631 answers. Those answers contained 2,227,822 citations, 83,835 of which were YouTube citations (links to youtube.com).
Our main measure is prevalence, which is the share of answers that cite YouTube at least once. A video citation is a YouTube citation that points to a specific video, so video-level analysis excludes 4,519 links to the YouTube homepage. A video appearance counts each video once per answer, even when the answer links to it more than once.
On 22 September 2026, we collected titles for the top 500 videos and fuller metadata for the top 150, along with random samples of videos cited only once. Usable sample sizes vary by table, and view and subscriber counts reflect that date.
Which AI Engines Cite YouTube the Most?
Of the three engines we measured, Google AI Mode and AI Overviews produced 98.2% of all YouTube citations, with AI Overviews alone making up 46.3%.
36% of Google AI Answers Cite YouTube vs 2.1% for ChatGPT
Google AI Mode and AI Overviews cited YouTube in 36.0% of answers, while ChatGPT did so in 2.1%. That makes a Google answer about 17 times more likely to include YouTube. Even ChatGPT’s strongest video query type, Reviews & Validation, reached only 4.1%.

| Engine | Answers | Answers citing YouTube | Share of YouTube citations |
|---|---|---|---|
| Google AI Overviews | 63,902 | 36.5% | 46.3% |
| Google AI Mode | 63,656 | 35.6% | 51.9% |
| ChatGPT | 55,073 | 2.1% | 1.8% |
| All three | 182,631 | 25.8% | 100% |
When Google does reach for YouTube, it often reaches more than once. AI Mode averaged 1.92 YouTube links in each answer that cited YouTube, and across the dataset, answers citing YouTube referenced 1.68 different videos on average.
For a team that wants YouTube citations, these results make Google the clearest priority within the engines we measured.
What Is Ask YouTube?
Ask YouTube is a conversational search experience inside YouTube that answers questions with a mix of text, videos and clips. It’s separate from Google AI Mode and AI Overviews, and our study didn’t measure it.
As of September 2026, it was available to signed-in US viewers aged 13 and older, and YouTube’s guidance says clear chapters and descriptive titles help its systems match video segments to viewer questions.
How Does YouTube Compare With Reddit, G2 and Vendor Sites?
YouTube’s role changes from engine to engine, while vendor sites and review sources show up often on all three. In the earlier 12-run analysis, YouTube appeared in 37.1% of AI Mode answers, slightly more often than Reddit at 34.8%.
On AI Overviews it trailed Reddit but sat well ahead of LinkedIn and Medium, and on ChatGPT it fell below almost every major source category. Because one answer can cite several kinds of source, the percentages in each column don’t add up to 100%.
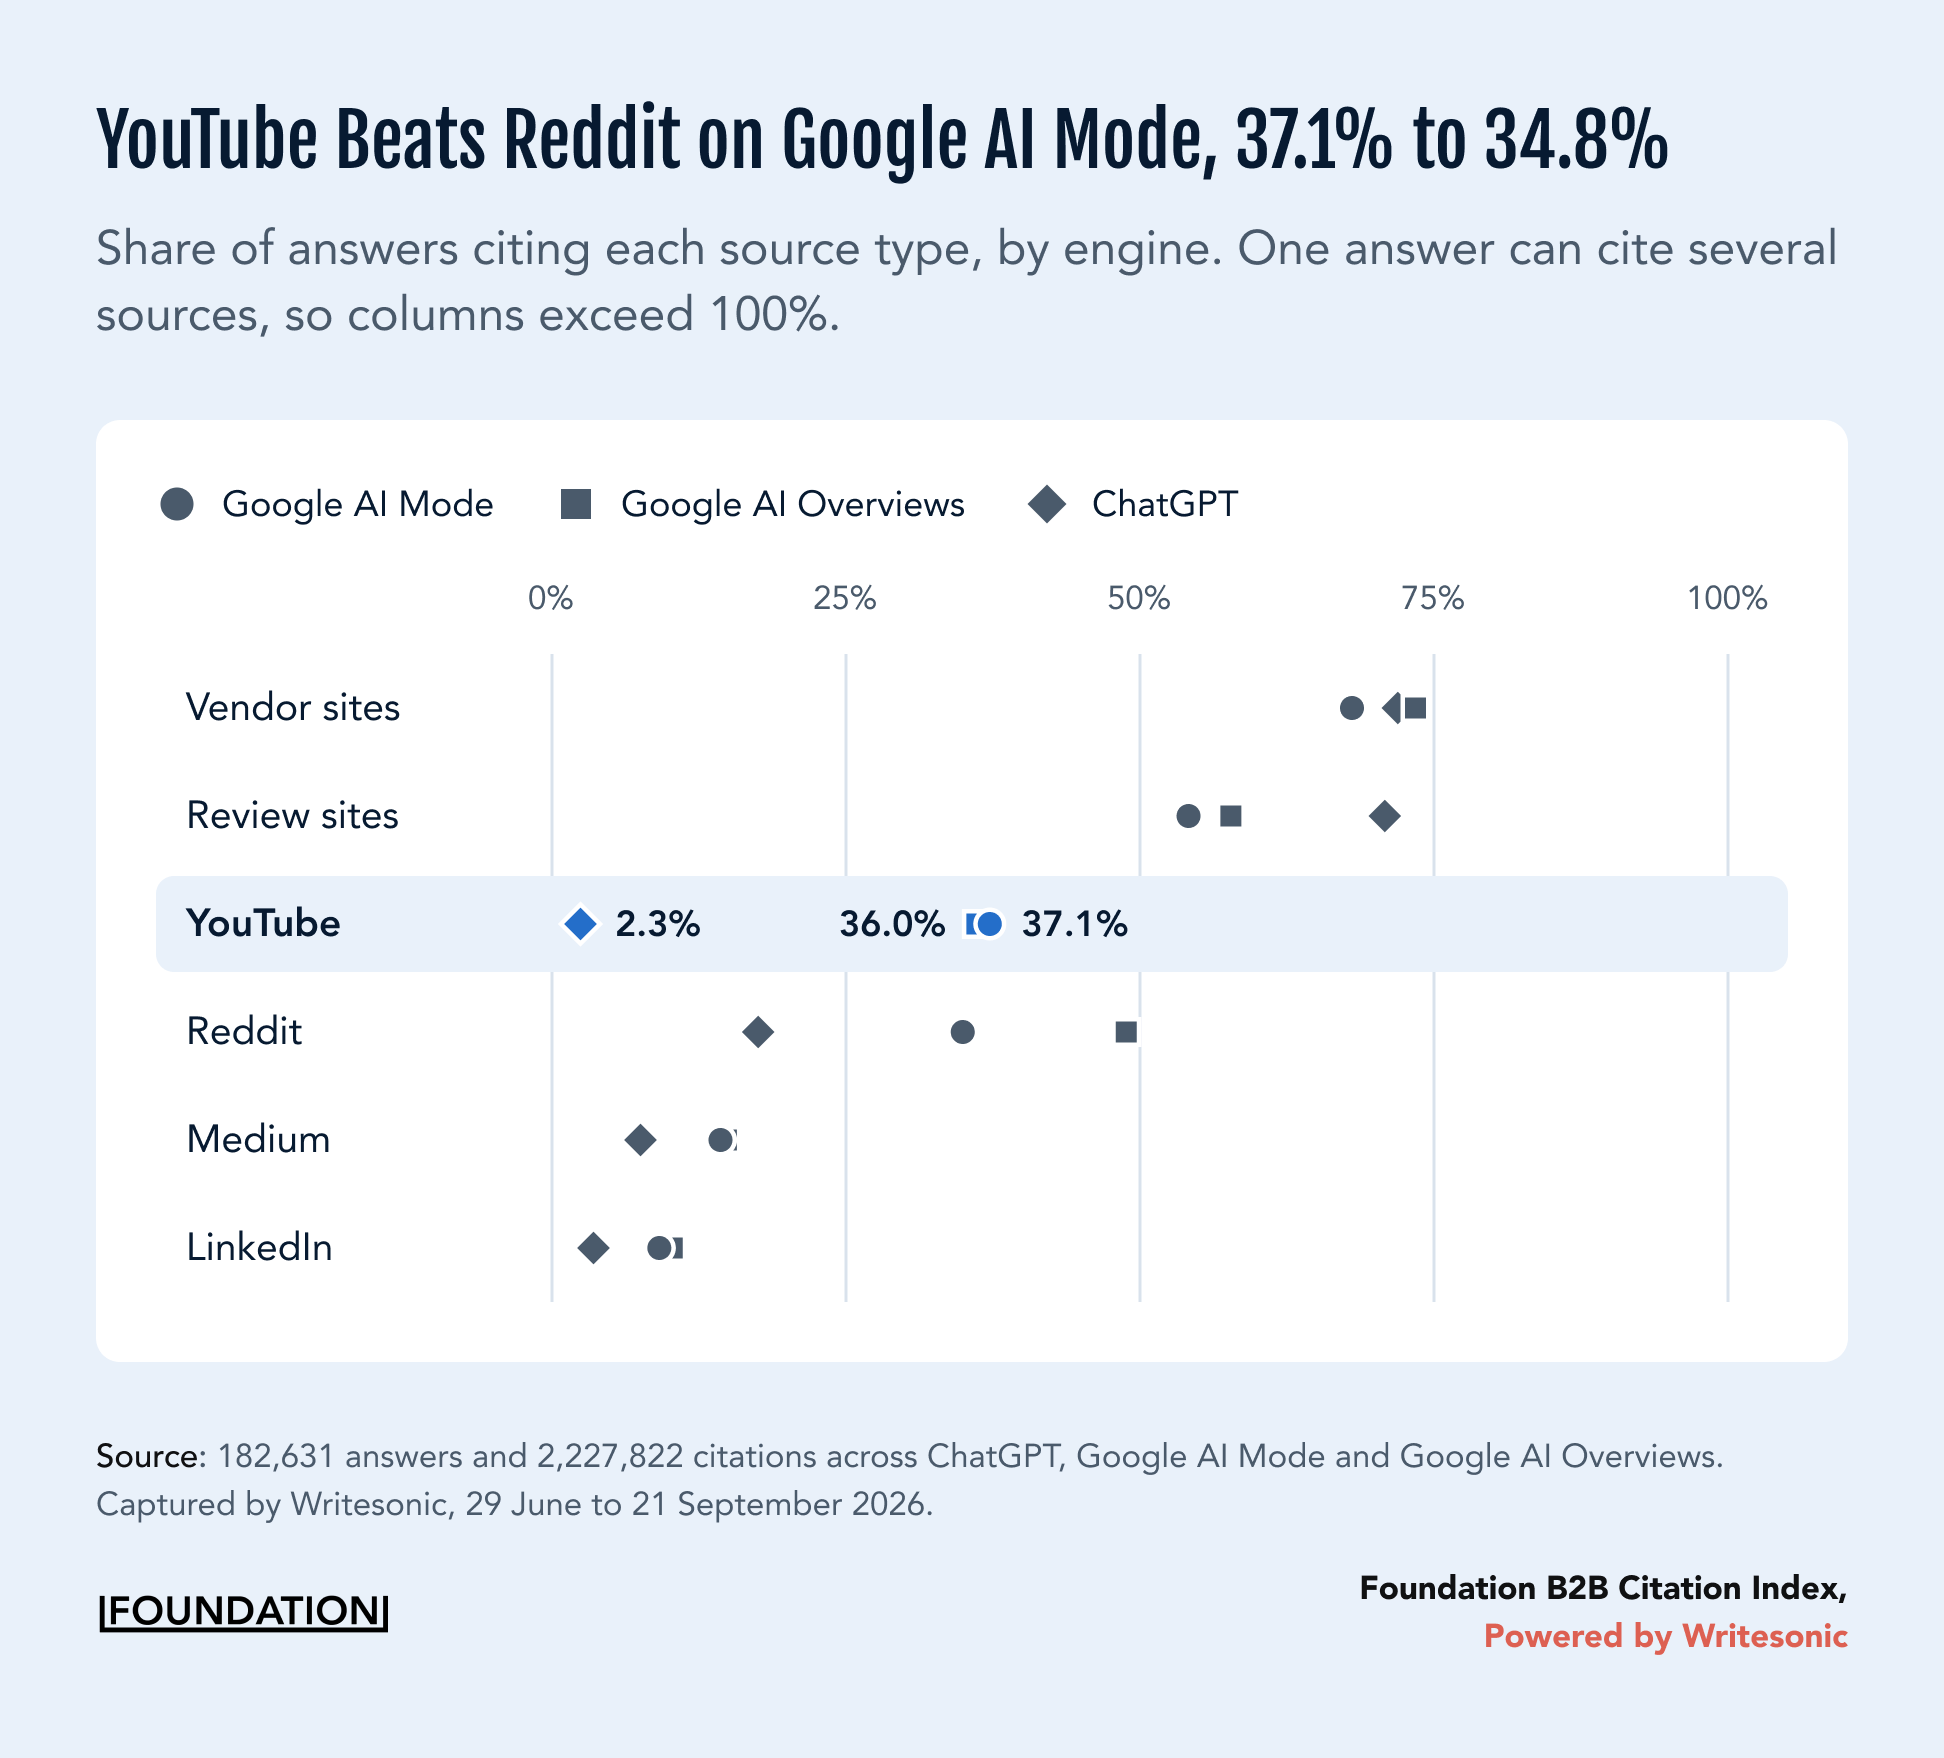
| Source | Google AI Mode | Google AI Overviews | ChatGPT |
|---|---|---|---|
| Vendor sites | 67.9% | 73.3% | 71.8% |
| G2 / review sites | 54.0% | 57.6% | 70.7% |
| YouTube | 37.1% | 36.0% | 2.3% |
| 34.8% | 48.7% | 17.4% | |
| Medium / blogs | 14.2% | 14.7% | 7.4% |
| 9.0% | 10.1% | 3.4% |
Source: Writesonic citation data from the first 12 weekly runs, June to September 2026. Three engines: ChatGPT, Google AI Mode, Google AI Overviews.
The source comparison supports a focused video effort on Google that runs alongside your comparison pages and review-site work.
How Much Do the Weekly Numbers Vary?
Weekly YouTube citation rates moved a lot. Across Google’s two AI features, prevalence ranged from 24.0% to 49.3% between runs, and AI Mode alone moved between 17% and 56%. The most recent run was AI Mode’s lowest, at 17.3%. Our per-engine noise threshold is 15 to 20 points, so none of this movement indicates a trend. We report the pooled 12-week result because single weeks swing this much. Judge your own YouTube visibility over several weeks, not one run.
Which B2B Buying Questions Pull YouTube Into AI Answers?
The question your buyer asks changes how often Google cites YouTube. Software category matters too, so the overall Google rate won’t tell every team where to focus.
“Best of” Prompts Cite YouTube 46.5% of the Time vs 19.1% for Pricing Prompts
Almost half of Google’s answers to “best of” prompts cited YouTube, compared with fewer than one in five pricing answers.

| Query type (Google surfaces) | Answers | Cite YouTube |
|---|---|---|
| Best Of | 23,068 | 46.5% |
| Reviews & Validation | 15,309 | 39.6% |
| Decision Criteria | 12,741 | 38.9% |
| Comparison | 38,258 | 34.9% |
| Switching & Migration | 10,192 | 33.6% |
| Alternatives | 15,250 | 32.8% |
| Pricing & Cost | 12,740 | 19.1% |
Source: Writesonic citation data from 127,558 answers on Google AI Mode and AI Overviews, 29 June to 21 September 2026.
YouTube prevalence varied even more by software category than by question type. Operations software led the broad verticals at 51.1%, while Product software sat at 25.5%.
At the segment level, the range ran from 63.2% for Project Management down to 13.2% for ABM Platform, and in nine of the 80 categories, more than half of Google’s AI answers cited YouTube.
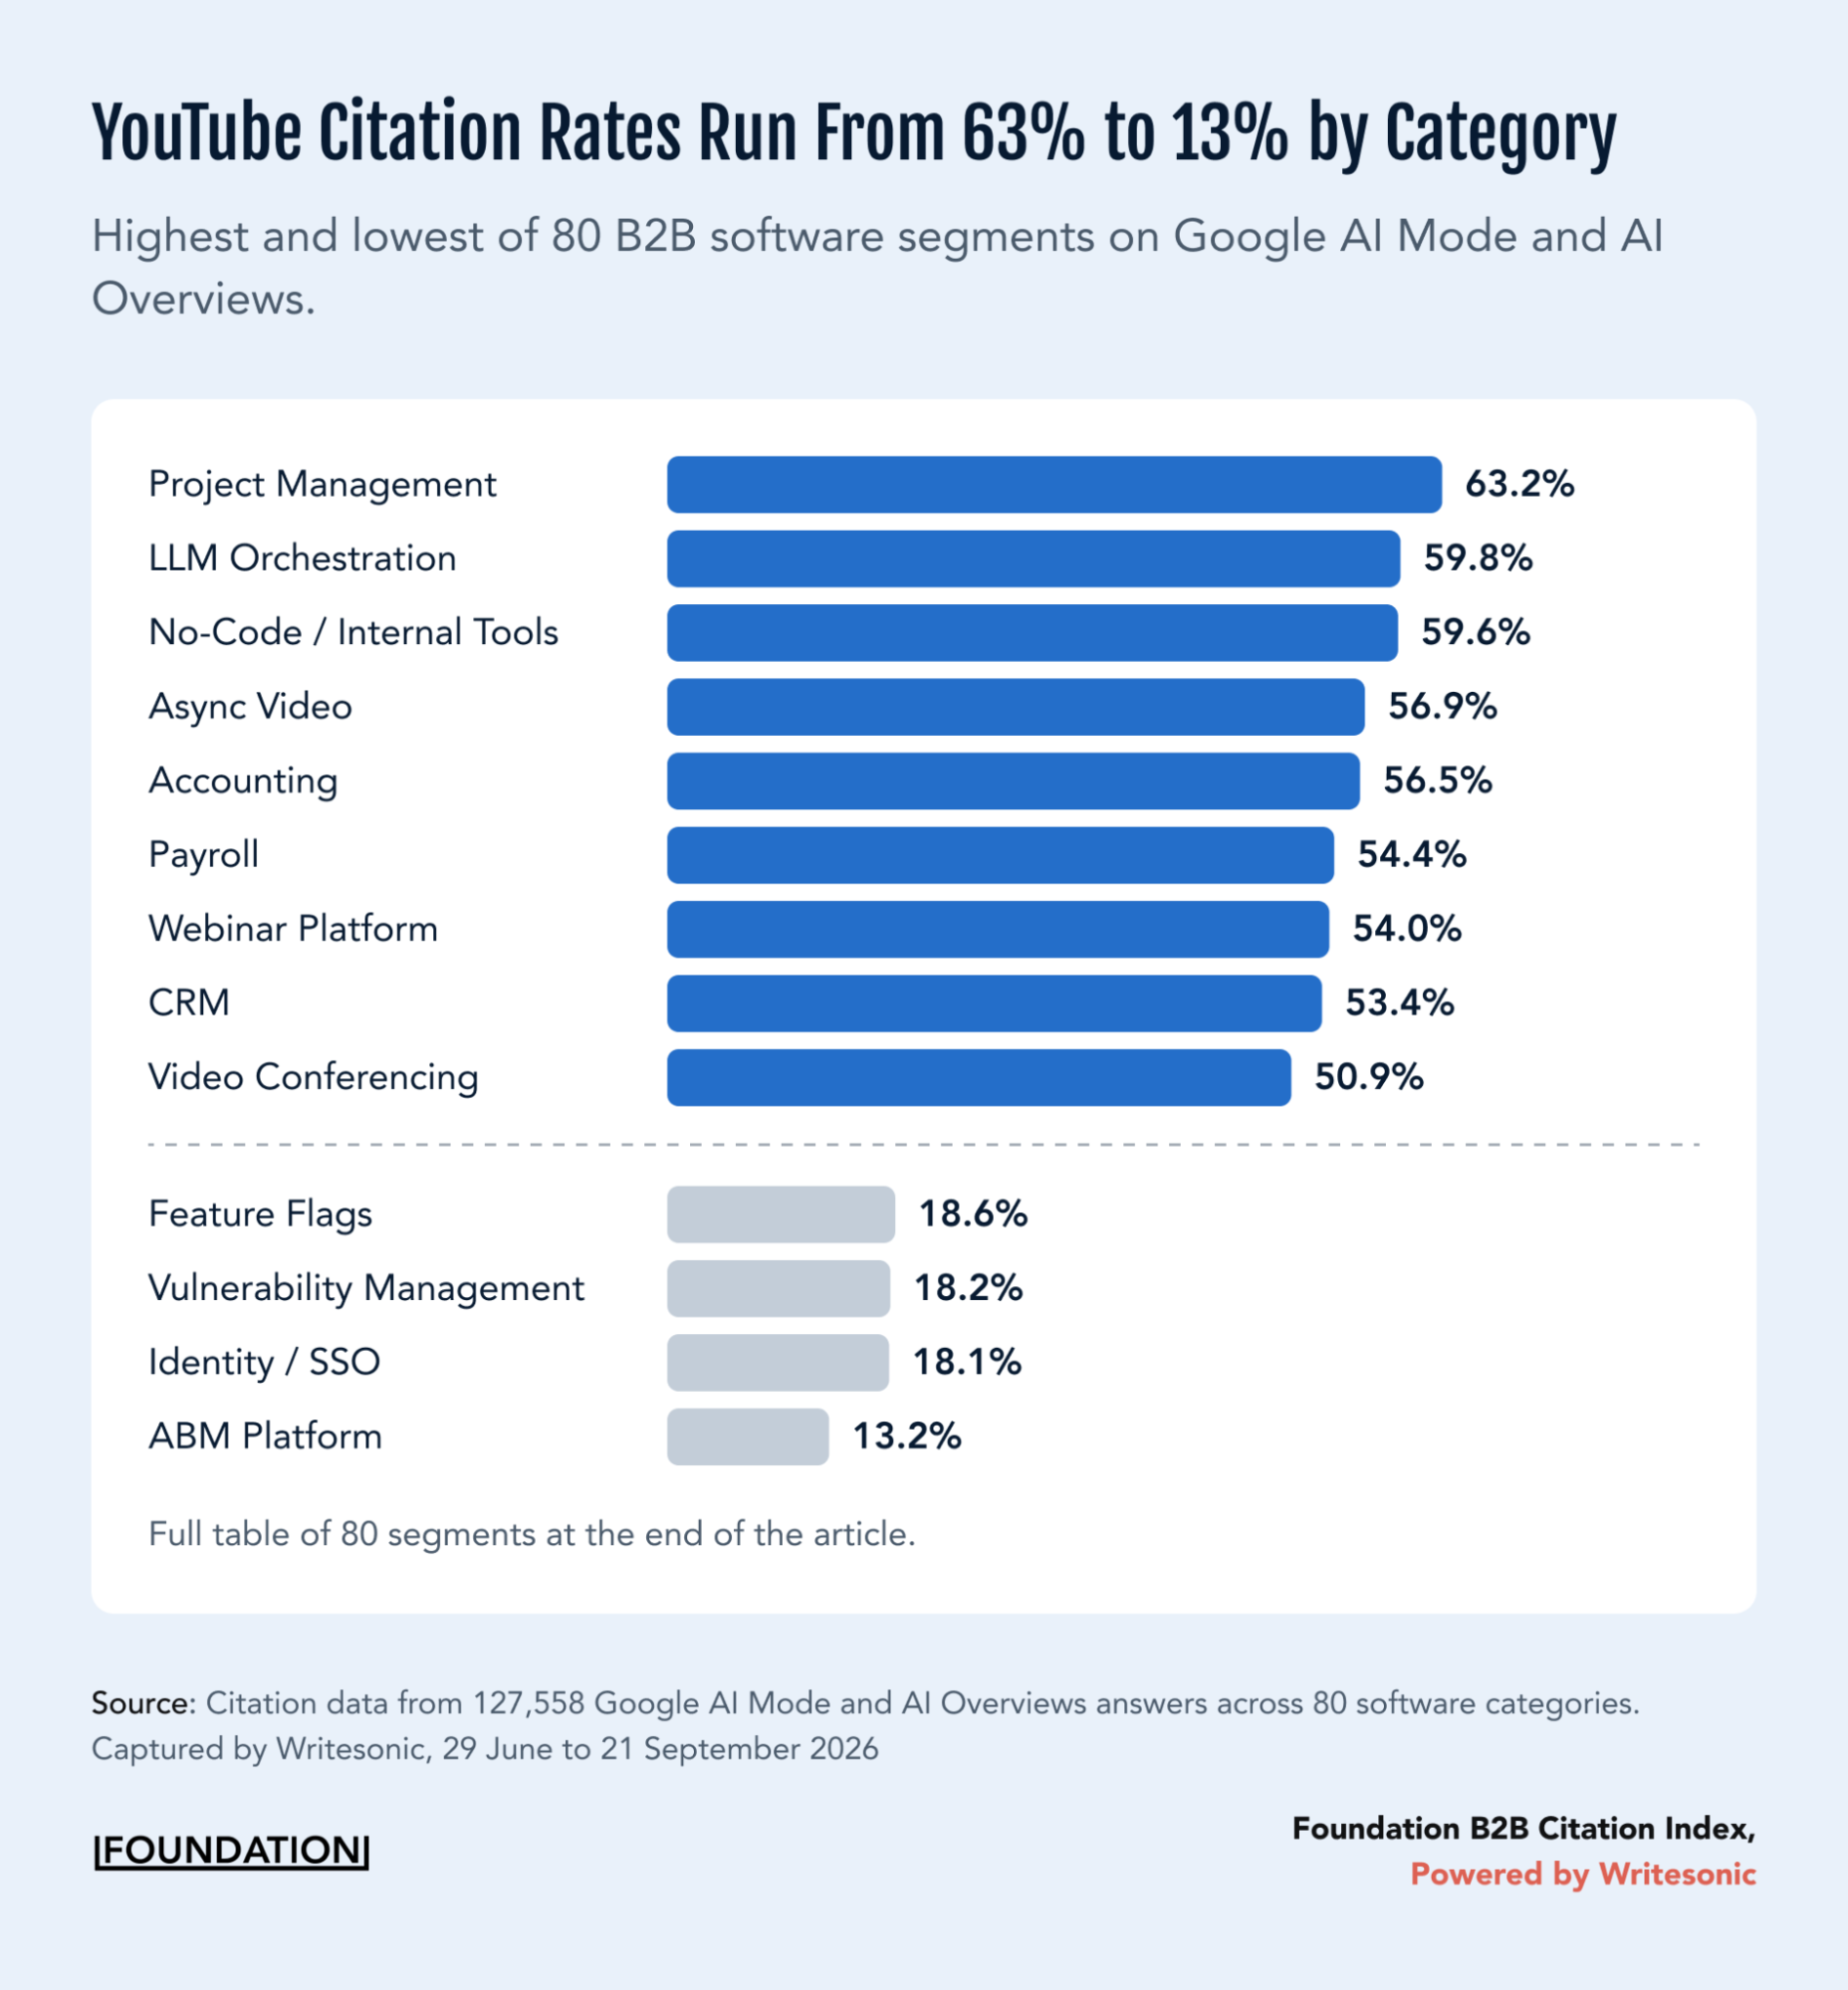
Our breakdown of AI citation fingerprints across B2B SaaS verticals shows how other sources vary by category, and the full segment table sits at the end of this article.
Check your category’s rate, then inspect the videos Google cites for the buying questions you want to answer. Lower rates make a weaker case for prioritizing video solely for AI citations.
These tables measure category and question type separately, so they don’t give a combined rate for “best project management software”, for example.
What Gets a YouTube Video Cited by Google’s AI Search Features?
We compared frequently cited videos with videos that appeared in just one answer. Differences in their titles, descriptions, length, and age offer practical starting points, though they don’t prove what drives citations.
59% of the Top 100 Videos Have “Best” or “Top” in the Title
The most-cited titles read like the buying question itself. “Best” or “top” appeared in 59% of usable top-100 titles, compared with 10% of the cited-once sample, and years and “vs” showed similar gaps.
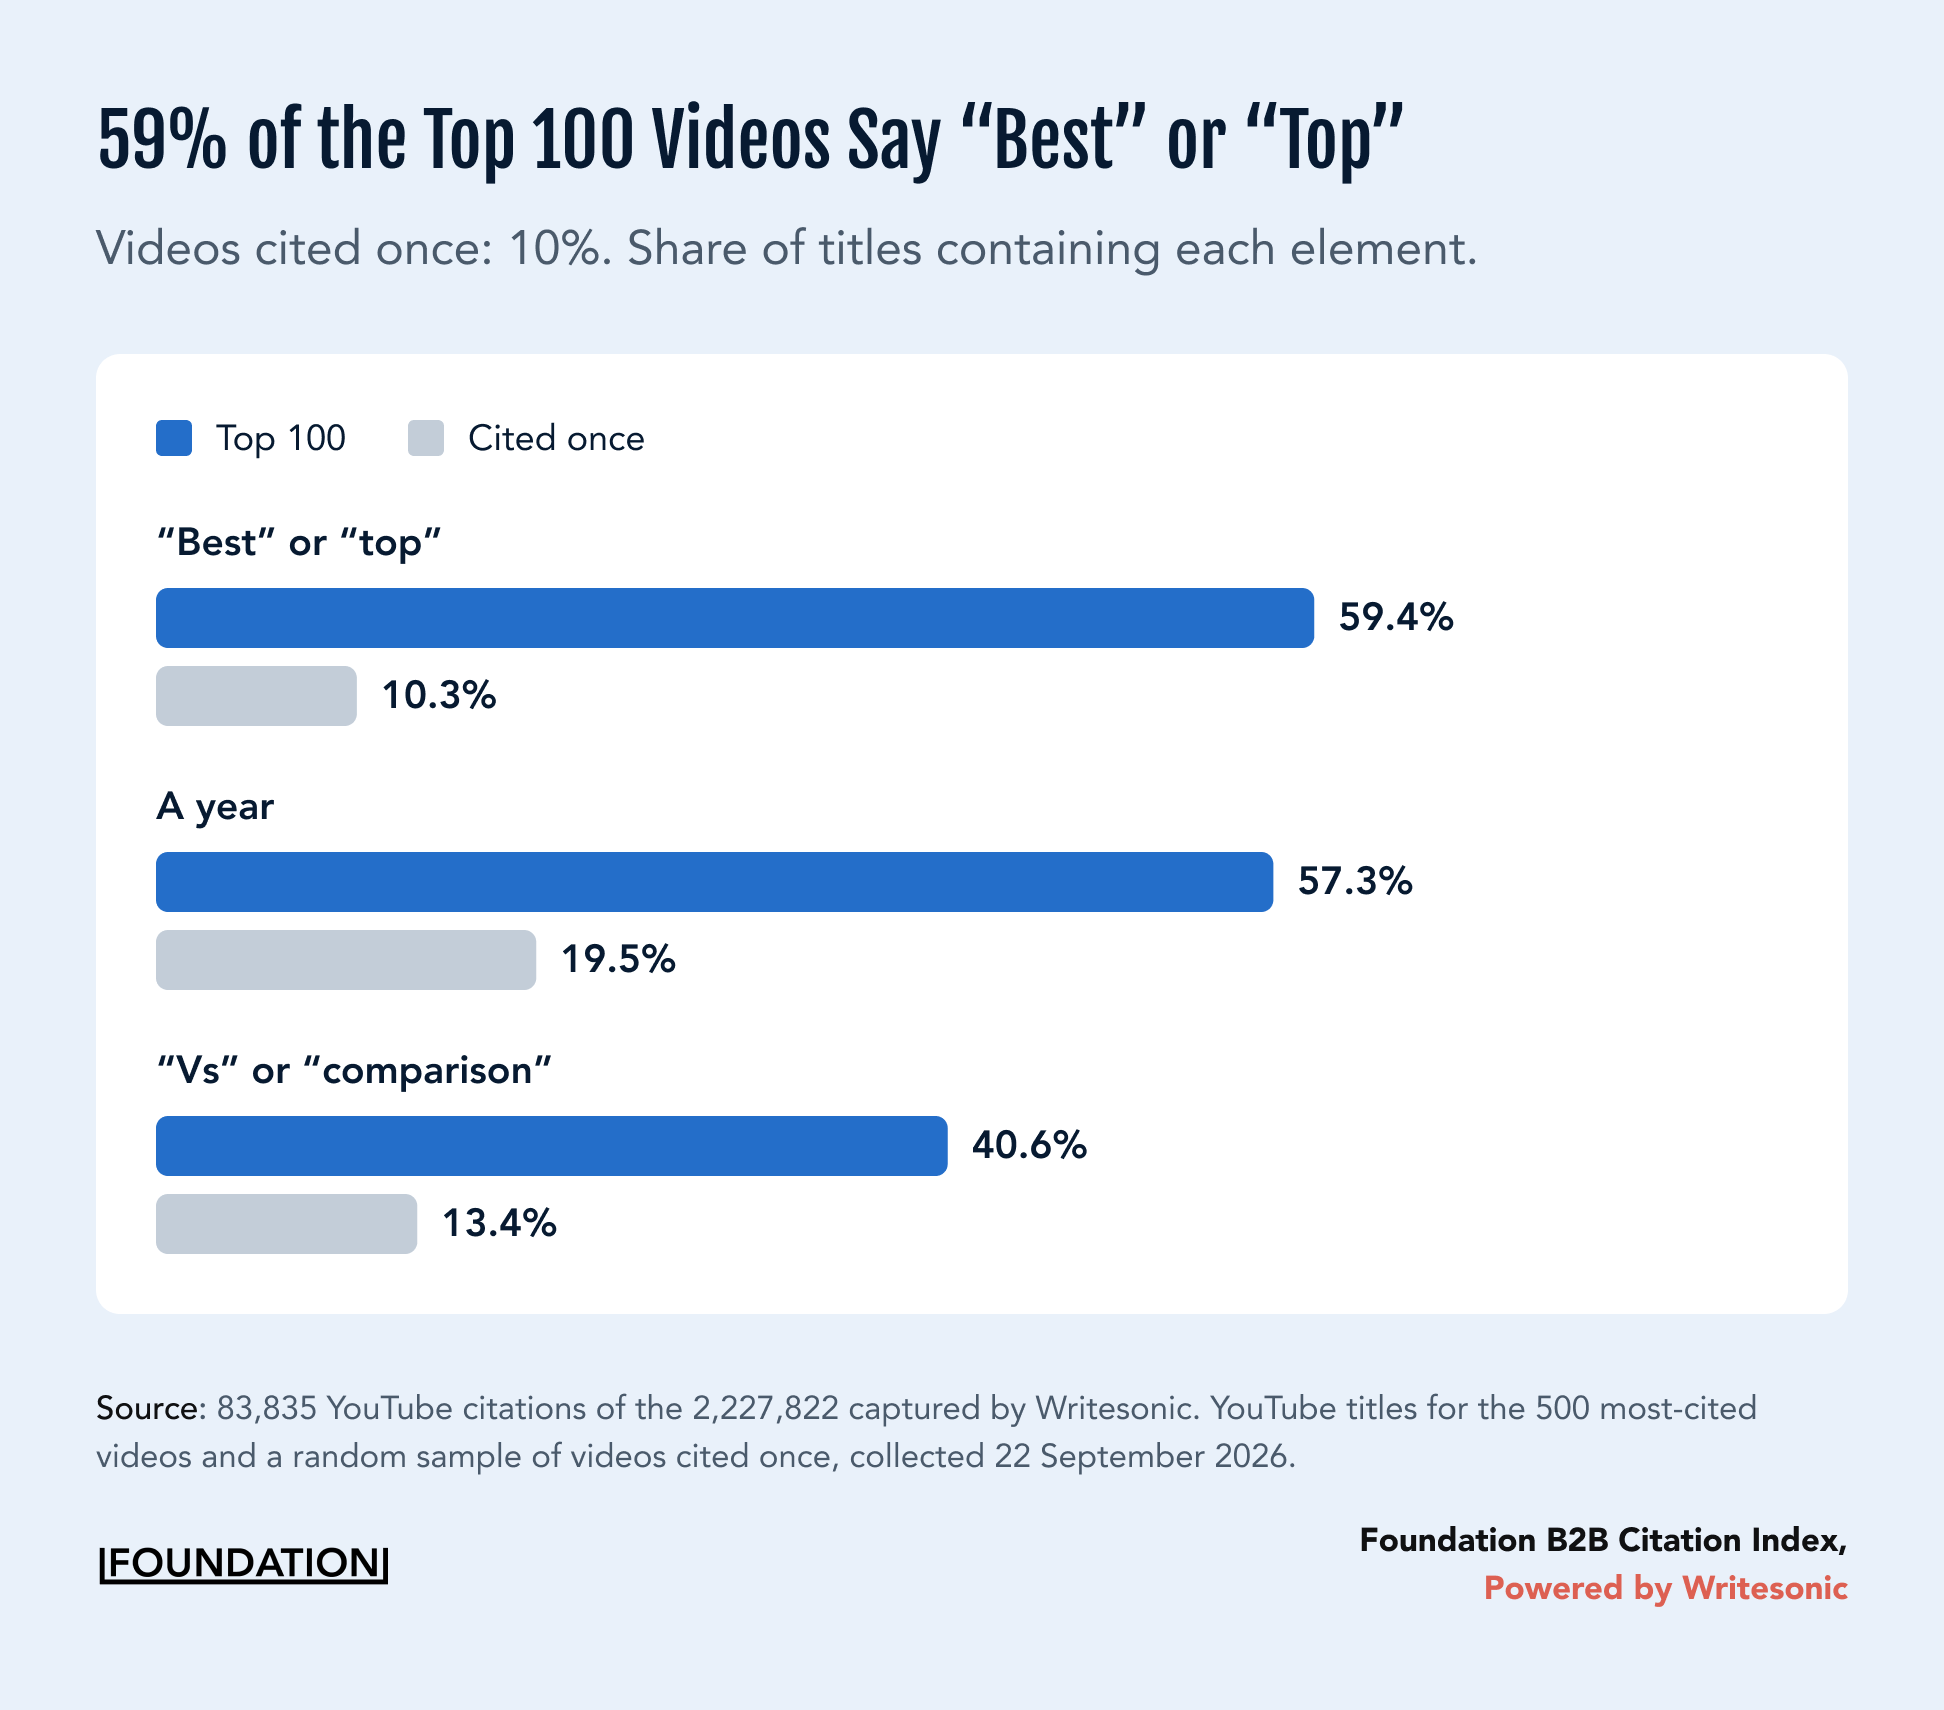
| Title contains | Top 100 | Top 500 | Cited once |
|---|---|---|---|
| “best” or “top” | 59.4% | 44.4% | 10.3% |
| A year (2025, 2026) | 57.3% | 37.0% | 19.5% |
| “vs”, “compared”, “comparison” | 40.6% | 37.4% | 13.4% |
| A number (Top 5, 7 Best) | 36.5% | 24.7% | 19.5% |
| “review” | 17.7% | 15.1% | 5.1% |
| “how to”, “tutorial”, “demo”, “guide” | 7.3% | 11.5% | 18.8% |
Source: Writesonic citation data plus YouTube titles for the 500 most-cited videos and a random sample of videos cited once, pulled 22 September 2026.
Titles such as “Top 5 Applicant Tracking Software in 2026” and “TalentLMS vs Absorb: Which LMS Is Better for Your Organization in 2026?” make the decision obvious by naming the category or the tools being compared and, where it matters, the year.
Because our prompts focus on buying decisions, “best of” and comparison titles fit the questions we tested. Demo-style titles didn’t stand out the same way.
Our earlier research found YouTube in Google’s top 10 for 80.2% of the demo searches we tested, yet in this study the combined “how to”, “tutorial”, “demo”, and “guide” title group was more common among cited-once videos (18.8%, compared with 7.3% of the top 100).
Ranking in search and earning AI citations are separate outcomes, so title each video for the buying question it answers.
Descriptions and Chapters
Frequently cited videos carried more structure in their descriptions. Descriptions with at least three timestamp lines, which is how we measured chapters, appeared on 56.0% of the top-150 videos and 33.1% of the cited-once group.
The median description was 1,543 characters in the top group, compared with 1,225 in the cited-once group. Use the space to explain the question, products, and comparison criteria rather than aiming for a fixed length. Tags were more common in the top group (82.7% against 67.6%), but treat that as a weak signal.
Do Transcripts Matter?
Our data doesn’t show a citation benefit from uploading your own captions. Captions were available on nearly every video in both groups, and manual captions were no more common among the top-150 videos (14.0%) than among the cited-once group (16.6%).
A better first step is to check auto-captions for errors, especially product names and technical terms, before paying for a transcript. Our guide to optimizing your YouTube channel for AI visibility covers caption review in more detail.
72% of Top-Cited YouTube Videos Run Between 5 and 15 Minutes
Videos of five to 15 minutes made up 72.0% of the top-150 group, compared with 43.4% of the cited-once group, which makes that a sensible starting range for a focused comparison.
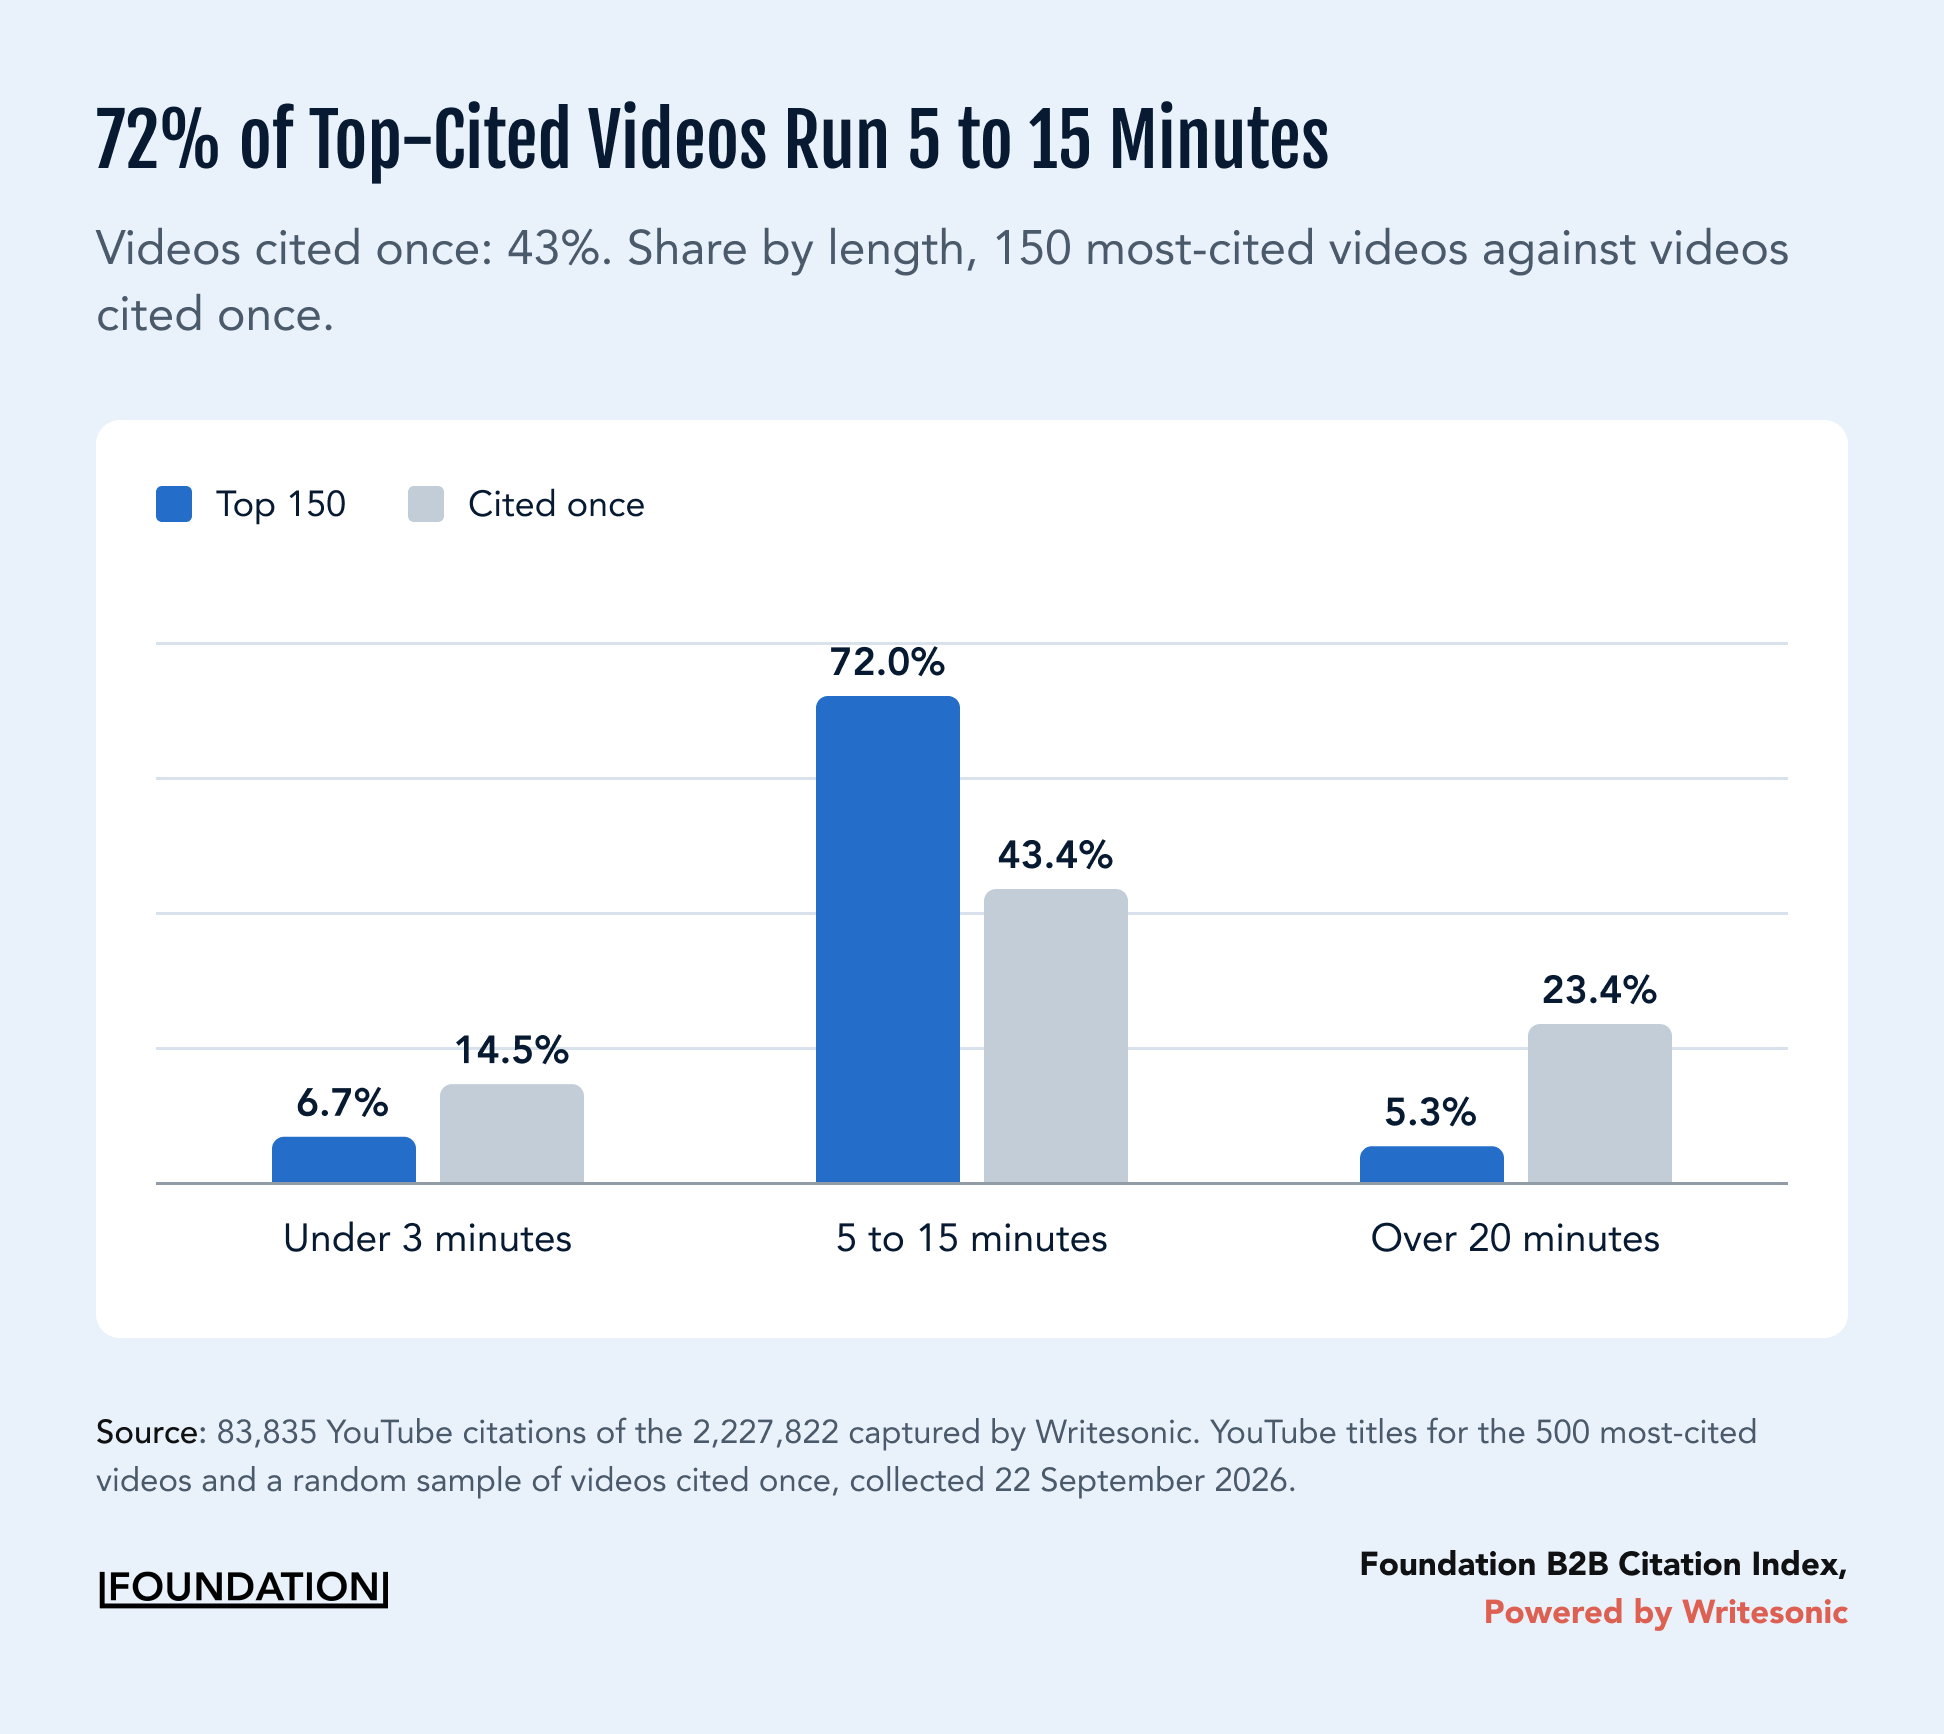
| Signal | Top 150 | Cited once |
|---|---|---|
| 5 to 15 minutes | 72.0% | 43.4% |
| Under 3 minutes | 6.7% | 14.5% |
| Over 20 minutes | 5.3% | 23.4% |
| Published in last 12 months | 68.7% | 39.3% |
| Median age | 9.3 months | 15.4 months |
Source: Writesonic citation data plus YouTube metadata for the 150 most-cited videos and a random sample of videos cited once, pulled 22 September 2026. Views and subscribers as of that date.
Newer videos were more common at the top: 68.7% of the top 150 were under a year old. Plan to refresh your comparison videos every year.
Shorts made up 3.7% of video citations, even though our research on Shorts in B2B search found Shorts in the top 10 for more than 1,100 “best + software” searches. Organic ranking and AI citation behave differently.
Full webinar recordings rarely become repeat citations. Videos over 20 minutes made up 5.3% of the top-150 group, compared with 23.4% of cited-once videos. If a webinar contains a clear answer to a buying question, cut that answer into its own five- to 15-minute video, and keep each one focused on a single question.
Nearly Half of Google’s YouTube Video Citations Include a Timestamp
Almost half of Google’s YouTube video citations (48.4%) included a timestamp, with 50.4% in AI Mode and 46.2% in AI Overviews, and we observed no timestamped ChatGPT video citations.
Among the timestamped links, the median moment was 2:28, and about 71% pointed to the first five minutes. Google also almost never cited two moments from the same video in one answer.

Google links to specific moments, so each moment needs to answer the question on its own. OtterlyAI also observed timestamped citations only on Google’s AI features.
State your verdict and comparison criteria early, and label important sections clearly. Google’s key-moments guidance supports using timestamps and labels to help people reach those sections.
Does Channel Size Affect Whether AI Cites Your Videos?
Small channels can earn frequent citations. Among the 150 most-cited videos, larger view and subscriber counts didn’t track with more citations, with rank correlations of −0.08 for views and −0.07 for subscribers.
The top group’s median view count of 1,207 was lower than the cited-once group’s 1,719, and median subscribers were almost identical at 15,900 and 15,600. Small channels were well represented in the top group as well, with 42% of the top 150 coming from channels under 10,000 subscribers and only 10.7% from channels above 100,000.
Several channels also placed more than one video in the top 500. Those 500 videos came from 284 channels, and the 63 channels with multiple entries accounted for 61.5% of the top 500’s video appearances.
A channel that earns one citation can earn several.
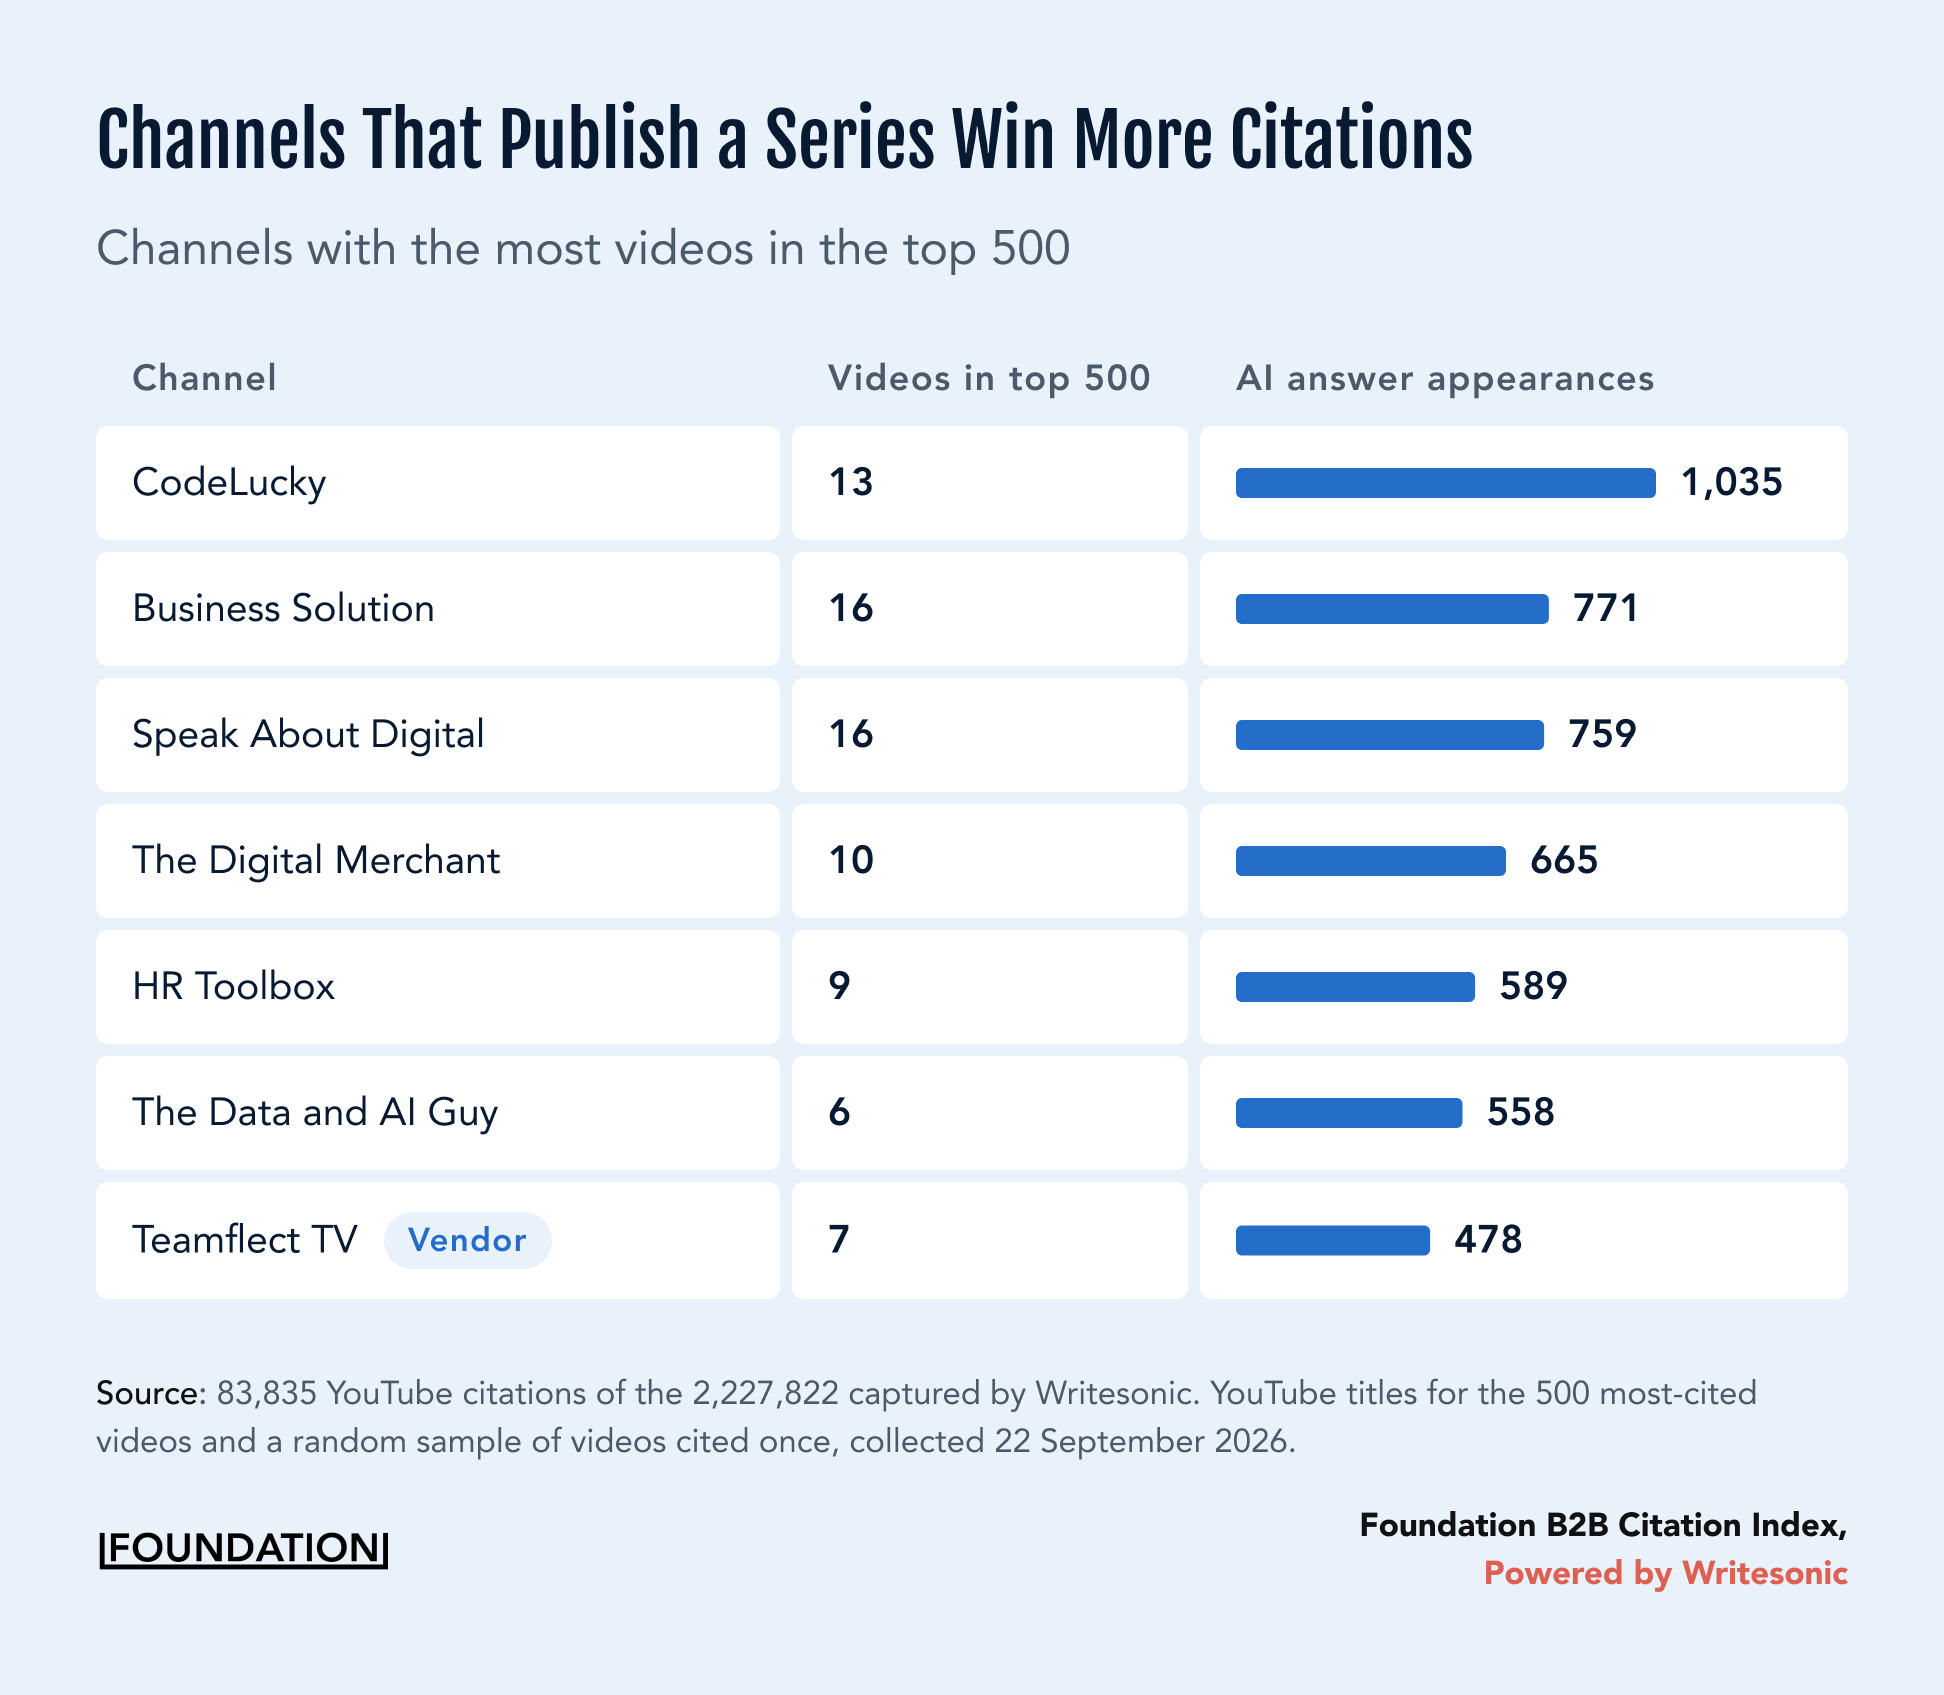
| Channel | Videos in top 500 | Video appearances |
|---|---|---|
| CodeLucky | 13 | 1,035 |
| Business Solution | 16 | 771 |
| Speak About Digital | 16 | 759 |
| The Digital Merchant | 10 | 665 |
| HR Toolbox | 9 | 589 |
| The Data and AI Guy | 6 | 558 |
| Teamflect TV (vendor) | 7 | 478 |
Source: Writesonic citation data plus YouTube metadata for the 150 most-cited videos and a random sample of videos cited once, pulled 22 September 2026. Views and subscribers as of that date.
Our audience-size findings sit alongside research from Ahrefs, covered in our Vol 278 newsletter, which found a 0.737 correlation between YouTube mentions and a brand’s visibility in AI answers.
Ahrefs measured brands, and we measured individual videos, but both point to the same practice: show up on YouTube for your category, even with a small audience.
23% of the Top 30 Videos Come From Vendor Channels
Seven of the 30 most-cited videos came from vendor-owned channels, and nearly all of them were category comparisons or “best of” lists that included competitors. Teamflect’s “Lattice vs 15Five vs Teamflect: Which HR Software Wins for Enterprise Organizations?” had 133 views and appeared in 158 AI answers.
Wiza’s “Best AI Tools for Sales Prospecting in 2026” had 2,098 views and appeared in 143, and Skyvia’s “Best ETL Tools in 2026” had 183 views and appeared in 168.
Skyvia’s video is a 41-second Short, which makes it an exception to the length pattern and a reminder that five to 15 minutes is a starting range, not a requirement.
Teamflect, Wiza and Skyvia also share a title built around a category decision instead of a single product.
View counts are as of 22 September 2026. Vendor ownership was classified by hand.
How Concentrated Are YouTube Citations in AI Answers?
YouTube citations have no clear incumbent. Citations spanned 17,780 videos, with the top 100 accounting for just 12.6% of video appearances and the top 500 for 31.5%. More than half of all cited videos (52.7%) appeared in a single answer.

The videos that do earn a place tend to keep it. In total, 3,016 videos appeared in at least five of the 13 weekly runs, accounting for 66.4% of all video appearances, and 176 of them appeared in every run. A video that matches a buying question well can earn citations week after week, not just once.
How to Optimize YouTube for AI Search
To optimize YouTube for AI search, use these findings to focus your next video on a relevant buying question. For the production steps of YouTube SEO for AI, see our guide to optimizing your YouTube channel for AI visibility.
The simpler path is to start with the comparison and “best of” pages you already have. Turning one into a focused five- to 15-minute video is cheaper than building a channel strategy from scratch.
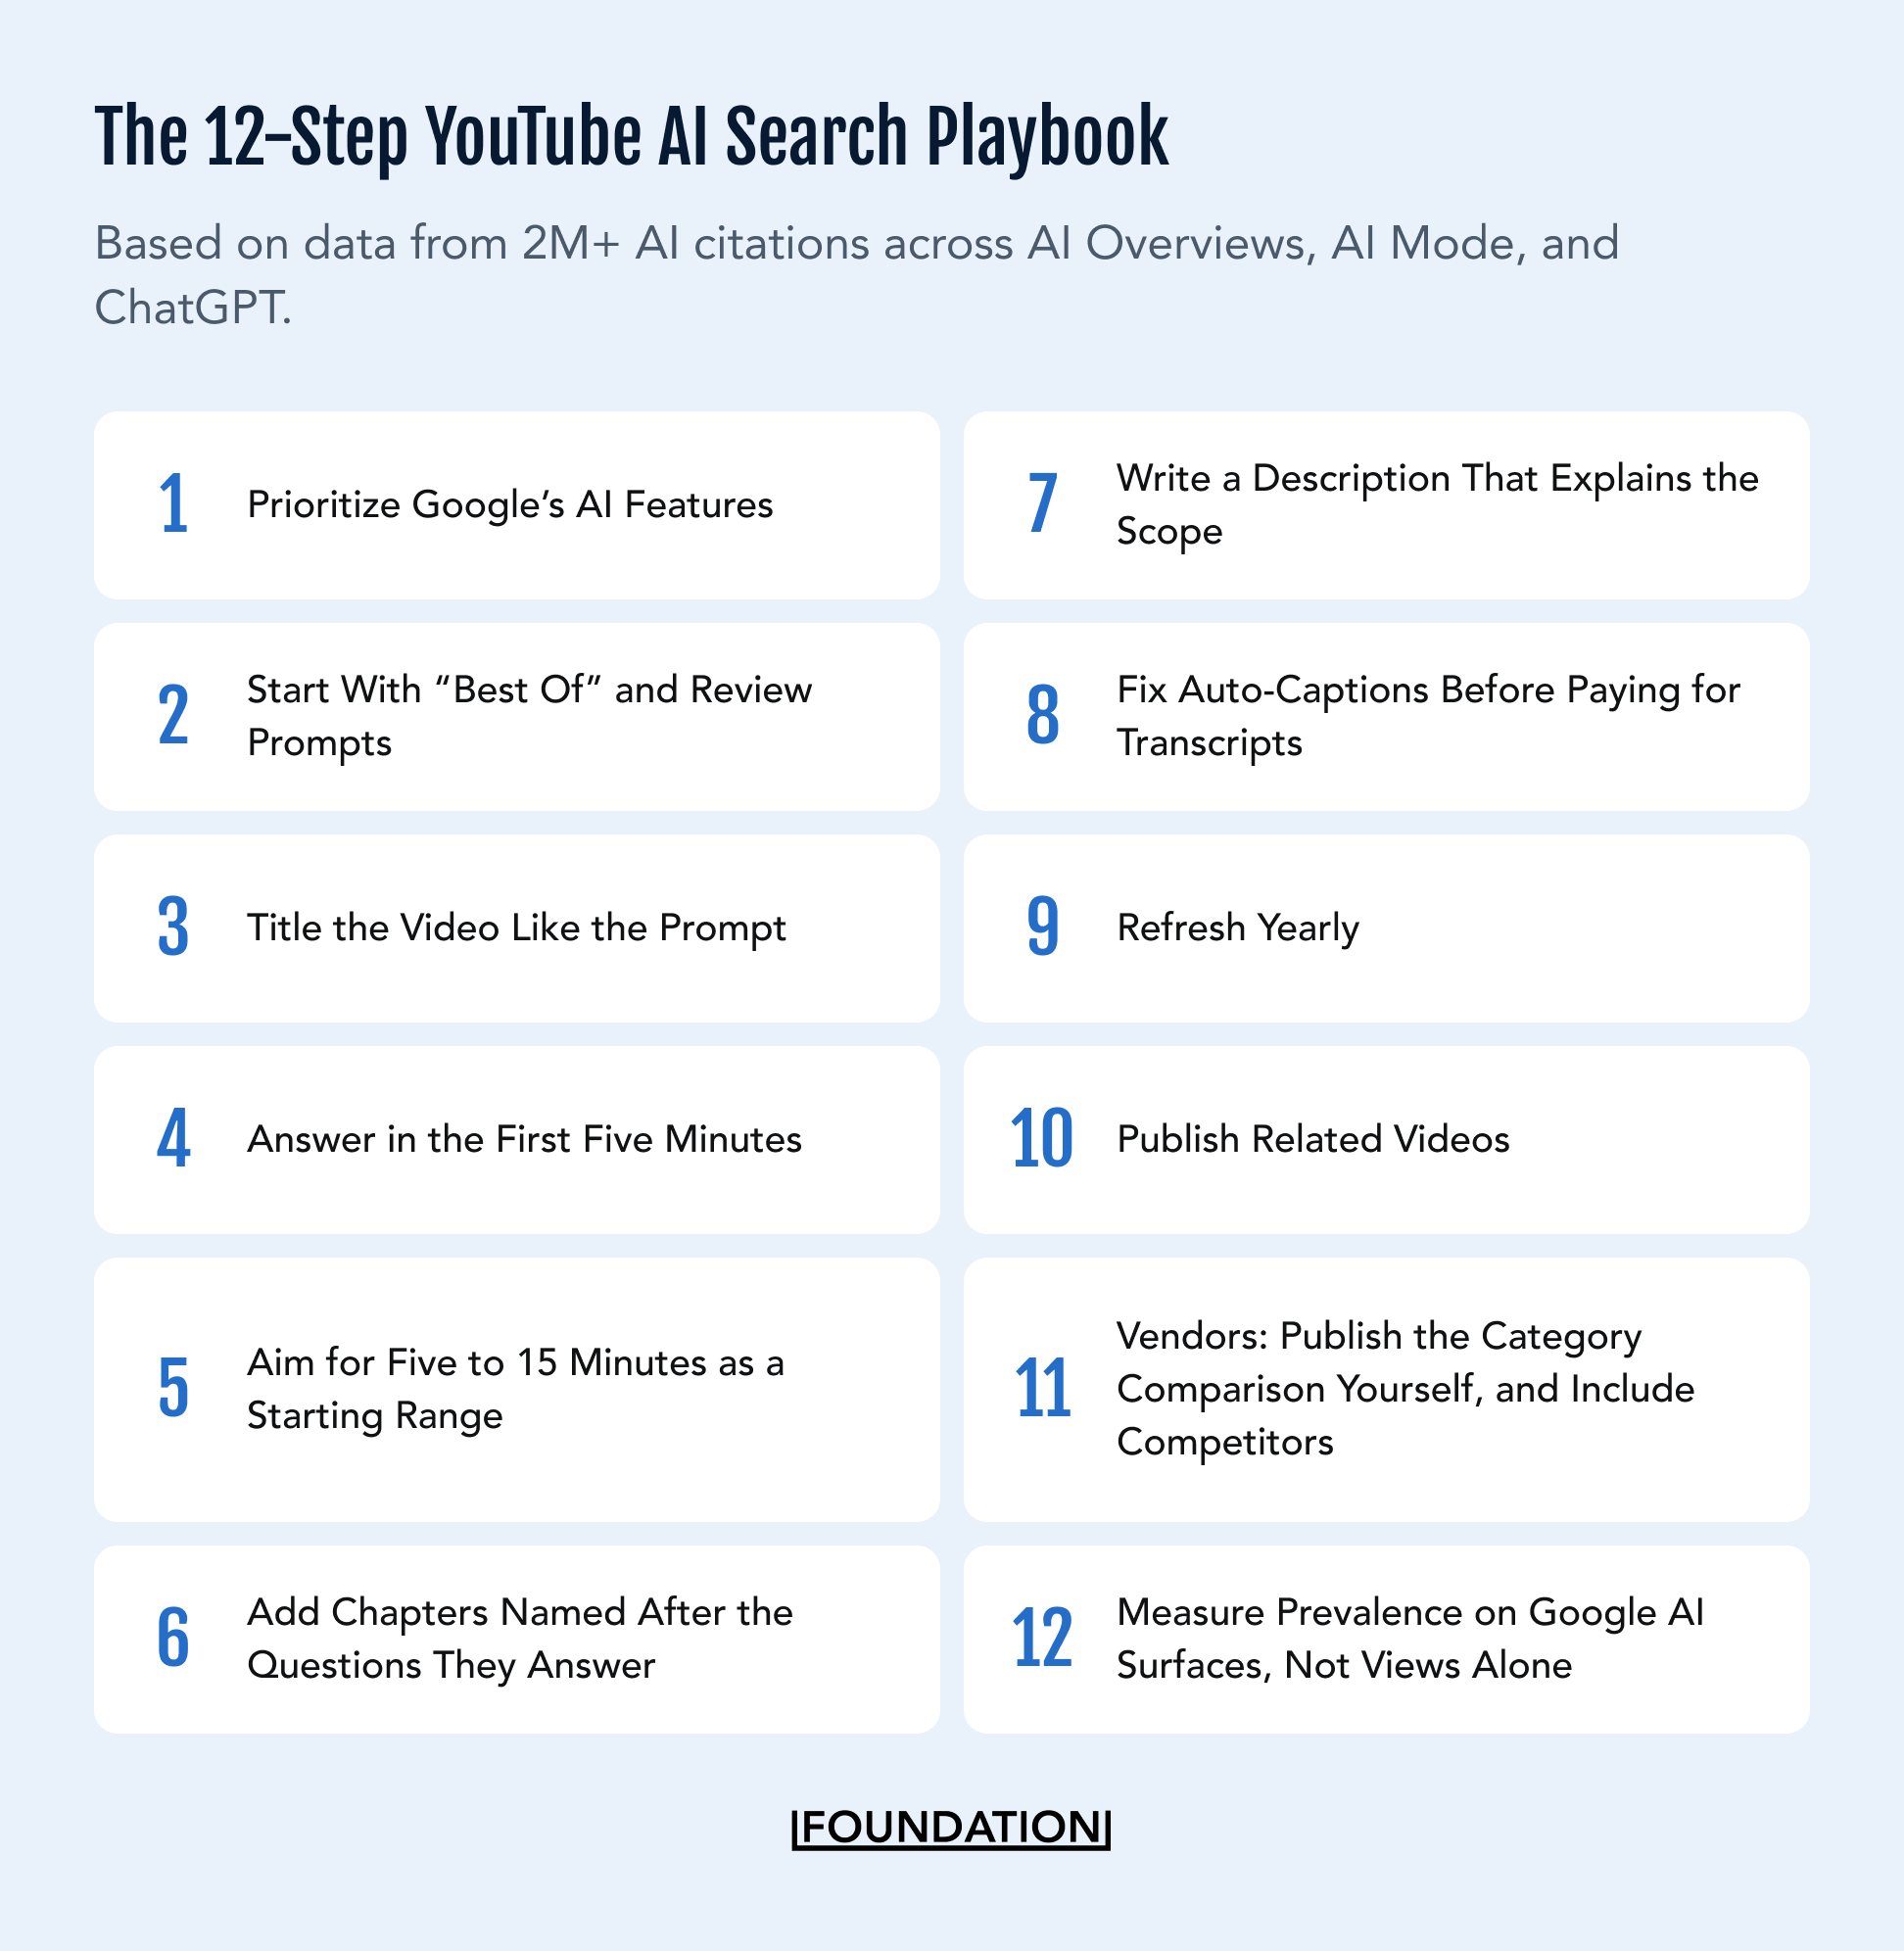
- Prioritize Google’s AI features. 98.2% of YouTube citations in our three-engine base came from AI Mode and AI Overviews. Plan for Google first.
- Start with “best of” and review prompts. On Google, 46.5% of “best of” answers cited YouTube, compared with 19.1% of pricing answers. Check your category’s rate in the appendix before you plan a video.
- Title the video like the prompt. Describe the real buying question accurately and use “best”, “vs”, or the year only when the content supports them. Of the usable top-100 titles, 59% used “best” or “top”.
- Answer in the first five minutes. About 71% of Google’s timestamped links pointed within the first five minutes. State the verdict and criteria early.
- Aim for five to 15 minutes as a starting range. 72% of the top-150 videos fell in that range.
- Add chapters named after the questions they answer. 56% of top-150 videos had at least three timestamp lines in the description, compared with 33% of cited-once videos.
- Write a description that explains the scope. The median description in the top group ran 1,543 characters, against 1,225 for cited-once videos. Summarize what the video compares and how you judged it.
- Fix auto-captions before paying for transcripts. Manual captions were no more common in the top group. Correct product names and technical terms in the auto-captions first.
- Refresh yearly. 69% of top-150 videos were under 12 months old, and 57% of top-100 titles named a year. When the year rolls over, republish your comparisons with current prices, features, and the new year in the title. A re-upload gets a new URL, so link the old video to the new one in its description and end screen.
- Publish related videos. The 63 channels with more than one top-500 video accounted for 61.5% of the top 500’s video appearances. Build on a useful category comparison by covering related buying questions.
- Vendors: publish the category comparison yourself, and include competitors. Seven of the 30 most-cited videos came from vendor channels, and nearly all compared the whole category.
- Measure prevalence on Google AI surfaces, not views alone. Track the share of relevant answers that cite your videos with a consistent prompt set (our guide to AI citation tracking covers the setup), keep it separate from the share citing any YouTube source, and track visits and leads where you can. Our guide to measuring the ROI of GEO shows how to connect the two.
Where Should a B2B Team Start With YouTube for AI Search?
Within the three engines we measured, Google offers the clearest opportunity for YouTube citations. Small channels appear among the most-cited videos, so audience size alone shouldn’t stop a B2B team from exploring it.
The natural place to start is a comparison or “best of” page you already have, turned into a focused video that answers the buying question early.
Use the patterns in this study to shape the title and the length, then track whether the video earns relevant citations before you expand.
If you want to know where your category stands, we can pull your category’s YouTube citation rate on Google’s AI surfaces and show you which videos are winning the answers your buyers see. Learn more about our B2B YouTube marketing work.
Limitations
This study shows where YouTube appears in AI answers and what the most-cited videos have in common. Five limits shape how you should use it.
Correlation Only
The patterns show what frequently cited videos shared, not what caused their citations. Title wording and video topic overlap in our data, so we can’t separate one from the other. Our chapter measure counted timestamp lines in descriptions, which misses automatic chapters, and we didn’t check how closely each timestamped moment matched its prompt. Use the traits as a checklist to test on your own videos.
Cited Once Isn’t Cited
Both comparison groups had already earned at least one citation. The findings explain what separates frequently cited videos from videos cited once, but they can’t tell you how never-cited videos differ.
No Traffic or Pipeline Data
The study measures citations only. It doesn’t track the clicks, leads, or revenue that follow, so measure those yourself alongside prevalence.
Volatility
Google AI Mode’s YouTube prevalence ranged from 17% to 56% across runs, and a single change in how Google uses YouTube could shift these results. Our repeat-appearance figures come from a fixed prompt set. They show how often videos returned during the 13 weeks, and they can’t predict how long a new video will stay cited.
Scope
The results cover 5,000 US prompts across ChatGPT, Google AI Mode, and Google AI Overviews. Perplexity wasn’t included, and OtterlyAI’s separate research found substantial YouTube citation volume there.
Appendix: YouTube Citation Rate by Software Segment
Share of Google AI Mode and AI Overviews answers that cited YouTube at least once, by software segment, pooled across 13 weekly runs and sorted from highest to lowest.
| Segment | Vertical | Google AI answers | Cite YouTube |
|---|---|---|---|
| Project Management | Operations | 2,632 | 63.2% |
| LLM Orchestration | AI/ML | 1,488 | 59.8% |
| No-Code / Internal Tools | Operations | 1,643 | 59.6% |
| Async Video | Operations | 1,087 | 56.9% |
| Accounting | Finance | 1,815 | 56.5% |
| Payroll | HR | 1,907 | 54.4% |
| Webinar Platform | Marketing | 1,403 | 54.0% |
| CRM | Sales & RevOps | 1,912 | 53.4% |
| Video Conferencing | Operations | 1,582 | 50.9% |
| Learning & Development | HR | 1,522 | 47.5% |
| Vector Database | AI/ML | 2,278 | 46.8% |
| Internal Developer Platform | Engineering | 698 | 46.4% |
| CI/CD | Engineering | 2,230 | 46.2% |
| Workflow Orchestration | Data | 1,592 | 45.4% |
| Data Warehouse | Data | 1,783 | 45.1% |
| HRIS | HR | 2,860 | 43.9% |
| Privileged Access Management | Security | 868 | 43.2% |
| Cloud Security (CSPM/CWPP) | Security | 1,233 | 43.1% |
| ML Platform / MLOps | AI/ML | 1,193 | 42.5% |
| Spend Management | Finance | 1,677 | 42.3% |
| AI Visibility / GEO | Marketing | 1,395 | 42.2% |
| Documentation / Wiki | Operations | 1,262 | 42.2% |
| AP / AR Automation | Finance | 1,088 | 41.9% |
| Streaming / Event | Data | 1,111 | 41.1% |
| Conversation Intelligence | Sales & RevOps | 1,954 | 41.1% |
| Live Chat / Messaging | Customer | 1,549 | 40.6% |
| BI / Analytics | Data | 2,445 | 40.5% |
| Team Communication | Operations | 1,357 | 40.3% |
| Sales Engagement | Sales & RevOps | 2,098 | 40.1% |
| Data Transformation | Data | 635 | 40.0% |
| Deployment / PaaS | Infrastructure | 1,070 | 39.9% |
| Marketing Automation | Marketing | 2,836 | 39.0% |
| Cloud Platform | Infrastructure | 1,025 | 39.0% |
| Content Marketing Platform | Marketing | 1,104 | 38.7% |
| Secrets Management | Engineering | 1,038 | 38.6% |
| Social Media Management | Marketing | 2,053 | 37.8% |
| Sales Intelligence | Sales & RevOps | 1,980 | 37.2% |
| E-signature / Contracts | Operations | 1,774 | 36.3% |
| Search Infrastructure | Infrastructure | 916 | 36.1% |
| Data Observability | Data | 1,351 | 35.6% |
| AI Eval / Observability | AI/ML | 1,900 | 34.4% |
| SMS / Telephony | Infrastructure | 1,150 | 32.9% |
| SIEM | Security | 1,763 | 32.8% |
| Managed Database | Infrastructure | 2,147 | 32.4% |
| Subscription Billing | Finance | 1,540 | 32.3% |
| AI Gateway | AI/ML | 1,427 | 32.2% |
| Performance Management | HR | 1,830 | 32.1% |
| SEO Platform | Marketing | 1,893 | 32.1% |
| CPQ | Sales & RevOps | 1,611 | 31.5% |
| User Research | Product | 857 | 31.4% |
| ETL / ELT | Data | 2,135 | 31.2% |
| GPU Cloud / Inference | AI/ML | 1,781 | 31.2% |
| Error Tracking | Engineering | 948 | 30.6% |
| Engagement / Culture | HR | 1,933 | 30.5% |
| Customer Support / Helpdesk | Customer | 2,167 | 30.2% |
| ATS / Recruiting | HR | 1,995 | 30.0% |
| Email Delivery (Transactional) | Infrastructure | 945 | 29.2% |
| Reverse ETL | Data | 757 | 28.9% |
| Product Analytics | Product | 2,312 | 28.8% |
| Employer of Record (EOR) | HR | 1,239 | 28.7% |
| Code Quality / SAST | Engineering | 1,101 | 27.8% |
| Roadmap / Product Feedback | Product | 1,925 | 27.5% |
| Revenue Operations | Sales & RevOps | 1,270 | 26.4% |
| Observability / APM | Engineering | 2,763 | 26.1% |
| GRC / Compliance Automation | Security | 1,250 | 25.8% |
| API Management | Engineering | 1,128 | 24.3% |
| Session Replay | Product | 1,341 | 24.1% |
| Customer Data Platform | Data | 1,694 | 23.4% |
| EDR / XDR | Security | 1,544 | 23.4% |
| Email Security | Security | 1,067 | 23.3% |
| Procurement | Finance | 1,748 | 23.2% |
| Data Catalog / Governance | Data | 1,473 | 22.7% |
| NPS / Feedback | Customer | 1,878 | 22.5% |
| Incident Management | Engineering | 1,860 | 22.1% |
| CDN | Infrastructure | 1,405 | 20.7% |
| Customer Success Platform | Customer | 1,565 | 19.1% |
| Feature Flags / Experimentation | Product | 2,115 | 18.6% |
| Vulnerability Management | Security | 1,478 | 18.2% |
| Identity / SSO | Security | 1,968 | 18.1% |
| ABM Platform | Marketing | 1,211 | 13.2% |

