



Article's Content
Article's Content
You bought an AI visibility tool. The dashboard says your brand shows up in 19% of tracked answers. But you don’t know if 19% is good. You also don’t know which of the missing 81% are costing you deals.
That’s the AEO strategy problem many B2B brands are stuck on right now.
Profound solved the measurement side fast. Deciding what to do with the numbers is a different problem. In our experience, most teams running Profound use maybe a quarter of it. They treat a strategy platform like a rank tracker and report a number upward every month without changing anything underneath it.
We run Profound across our client portfolio as a Profound partner. This is the exact five-step workflow we use to turn the platform’s data into a plan that gets brands cited and recommended when buyers ask AI. It ends with an honest account of the four workstreams no tool will run for you.
An AEO Strategy Requires Instrumentation and Implementation
Answer engine optimization (AEO) is the work of getting your brand cited and recommended inside AI-generated answers on engines like ChatGPT, Perplexity, Gemini and Google AI Overviews. Many teams call the same work generative engine optimization (GEO).
Most teams with an AI visibility tool are doing monitoring. They check a score and send a chart up the chain. AEO strategy starts after the reading. It’s when you decide which gaps you need to work on and in what order.
Profound tells you how your brand shows up across AI surfaces. That still leaves two jobs:
- Setting up your Profound Space to collect data from the right prompts
- Turning the data into a strategy you can action across the channels that matter
Foundation is a verified Profound Partner, so our strategists are well versed in both the setup and the strategic follow-through.
| Key takeaway: Getting cited in AI answers takes a tracking tool and a team. The tool reports where you stand. Someone still has to configure it around the right prompts and do the work that impacts the bottom line. |
The 5 Steps to Building Your AEO Strategy with Profound
Tracking AI visibility isn’t the same as tracking rankings. You’re not watching one results page. You’re watching several engines that pull from different indexes, cite different sources and can describe your brand differently on the same question.
There’s no single position to report and no equivalent of ranking first. Instead, run these five steps every month:
- Find your AI visibility baseline for key topics
- Map your prompts to funnel stages
- Find your citation gaps and the sources engines trust
- Prioritize fixes by revenue impact
- Measure movement monthly
This is the workflow Foundation uses for clients, and it runs on two Profound modules. Answer Engine Insights shows how engines describe your category and which sources they cite. Prompt Volumes shows what people ask AI and how often.
Step 1: Find Your AI Visibility Baseline for Key Topics
AI visibility is how often AI engines mention your brand when people ask about your category. Profound splits brand visibility into a few different GEO metrics:
- Visibility Score is the share of tracked answers that mention you.
- Share of Voice is how often you’re mentioned compared with every competitor you track.
- Citation Share is how often a source, like your domain, gets cited across all citations in a window.
Profound also provides this data at different levels of granularity.
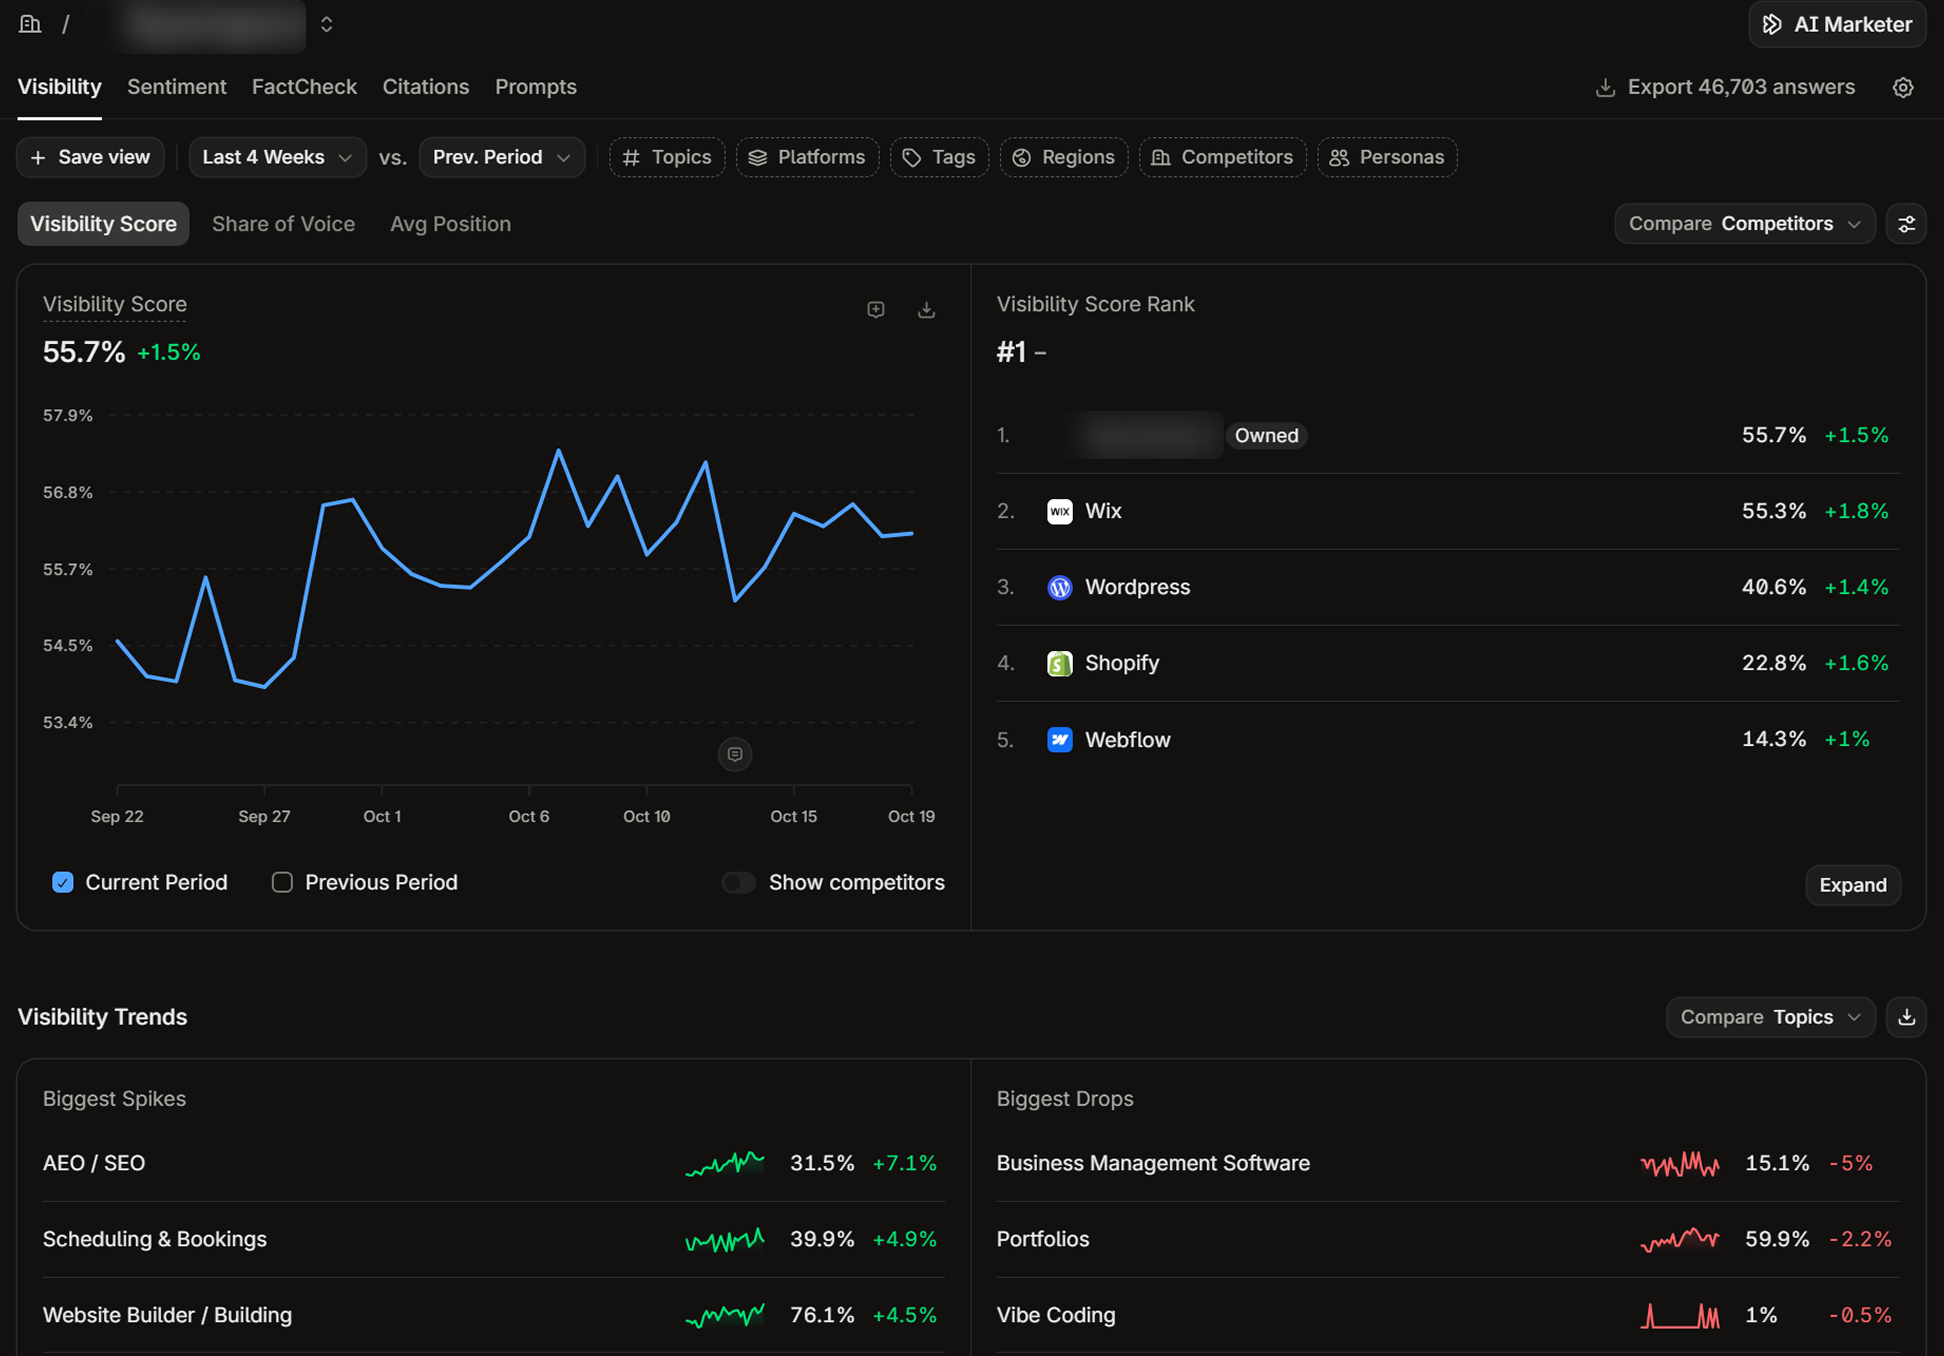
The headline view gives you three brand-level numbers: Visibility Score, Citation Share and Share of Voice, each calculated across every prompt you track.
The stakeholder question is “are we winning in AI search”. The headline view is the answer to that question. It’s one line in a deck, it’s directionally true, and it tells you nothing about what to do on Monday.
The topic view breaks the same three metrics down by subject, one row per topic. This is where a 19% brand score turns out to be 42% across three topics you already own and 4% across the five topics your sales team cares about most. Same data, and the only version of it you can act on.
Pull the baseline in four passes.
Pass One: Overall AI Visibility
Note the three headline numbers (Visibility Score, Share of Voice and Citation Share) and move on.
Pass Two: Topic-Level AI Visibility
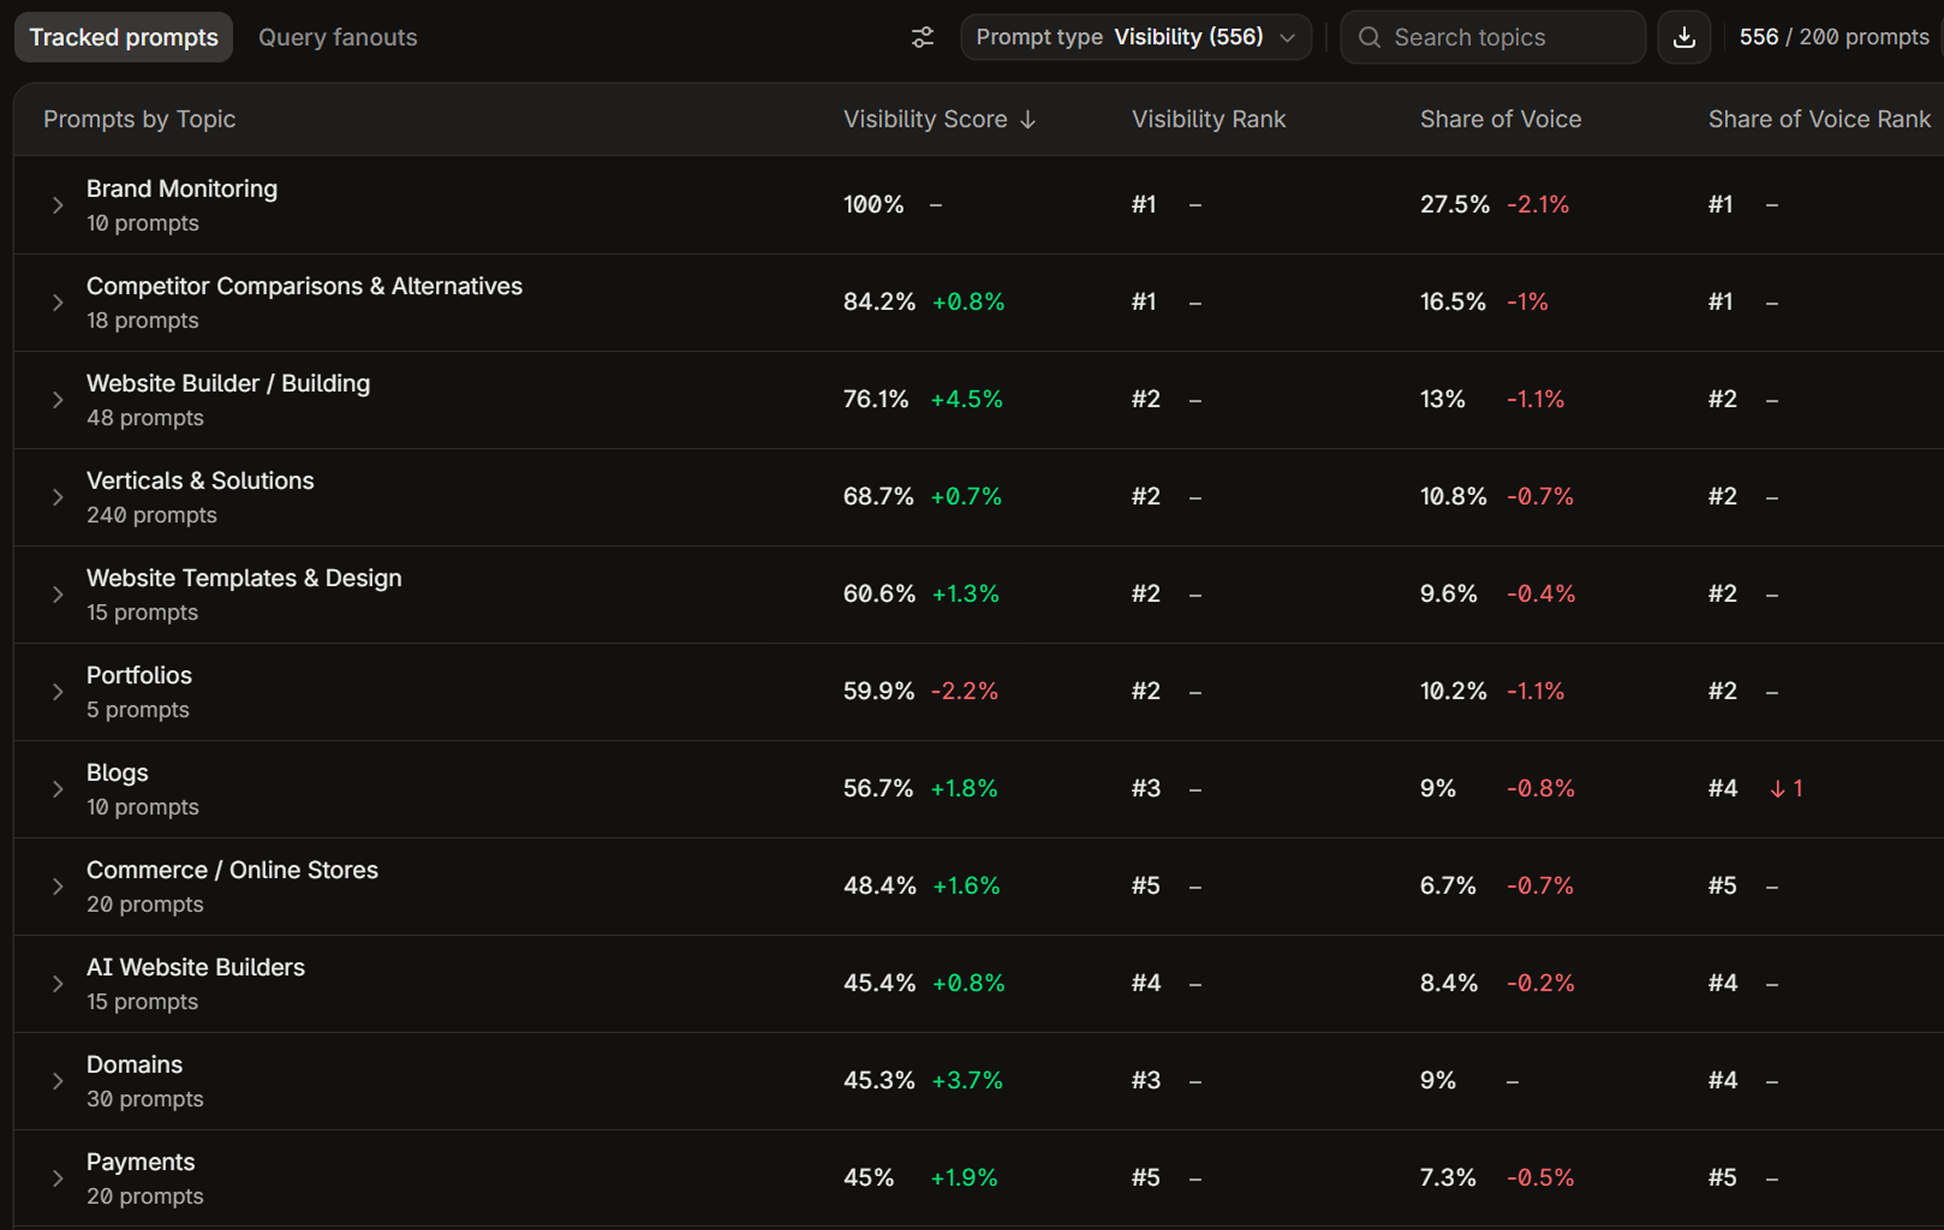
This is the working view. For each topic, read four numbers together: visibility rank, visibility percentage, citation percentage and prompt volume. Then sort topics into where you’re strong and where you’re weak. High volume with low citation is a different problem from low volume with high visibility, and the aggregate hides both.
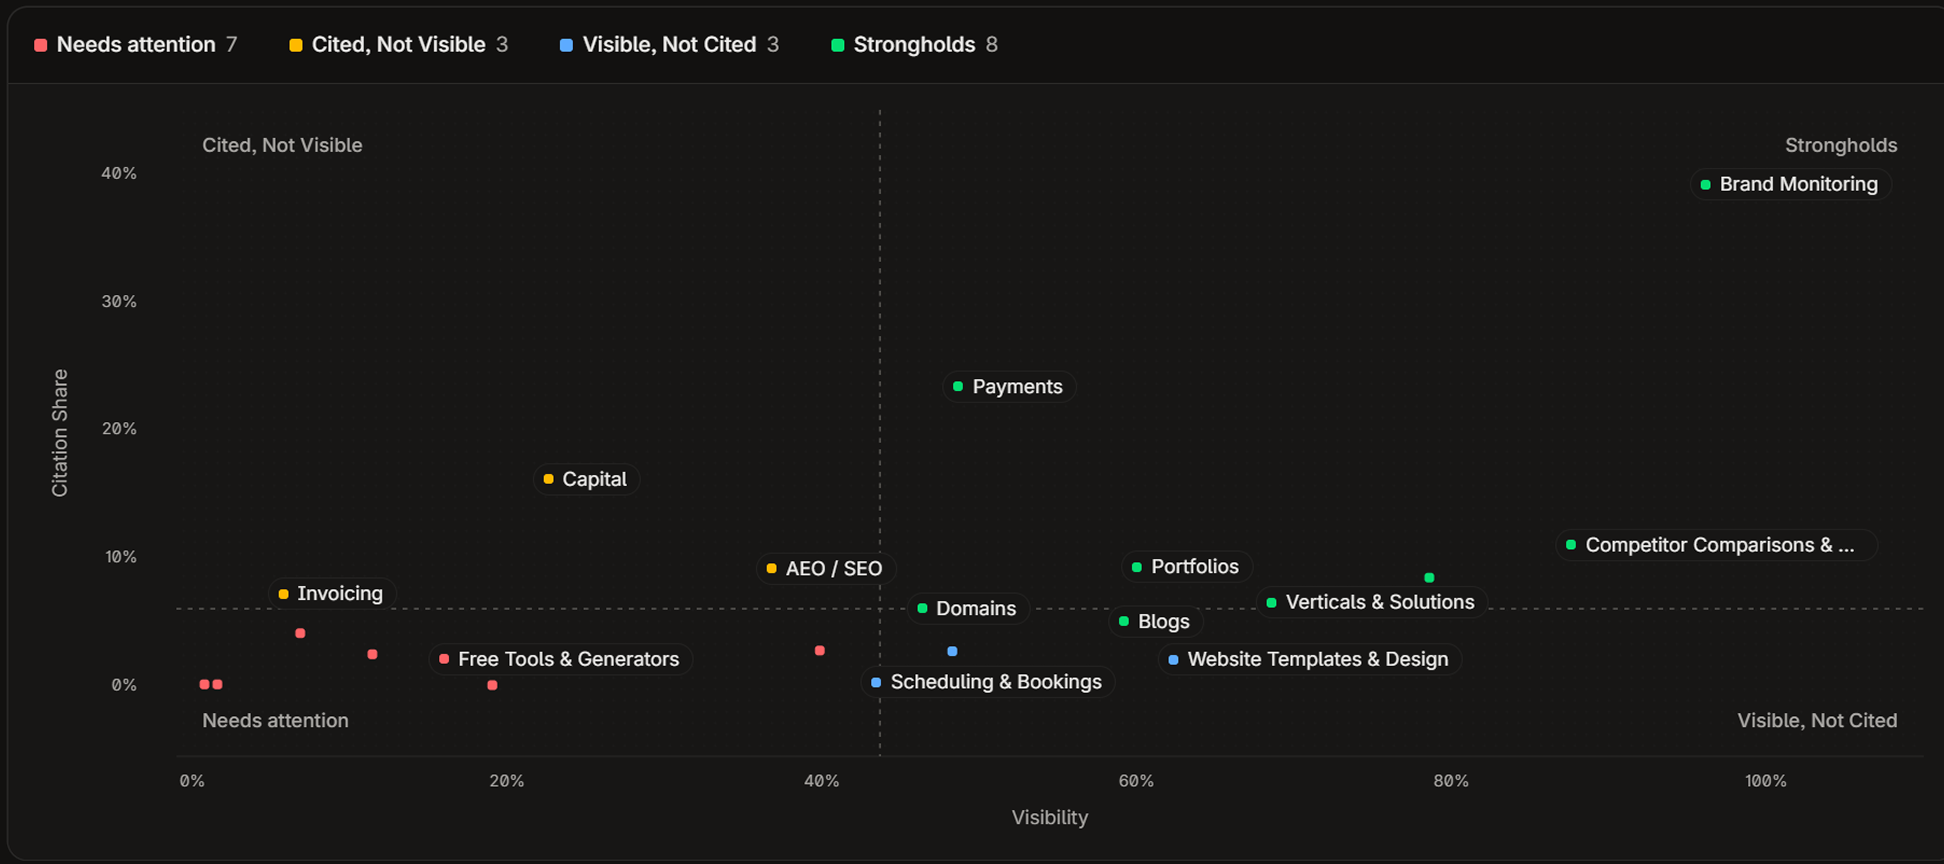
Profound’s Topic Prioritization view does a first pass for you. It plots topics by Visibility Score and Citation Share into four groups: Strongholds, Needs Attention, Cited Not Visible and Visible Not Cited.
The harder question underneath is whether you’re tracking the right prompts at all. That’s Step 2.
Pass Three: Competitive AI Visibility
Share of Voice is the right overall competitive metric. It reflects whether the model treats your brand as a known entity in the category. Leadership will ask about visibility. Point them at citation. In our client work the chain runs one way: citation drives visibility, and visibility drives Share of Voice.
| Watch for: Visibility scores swing 5 to 10 points week over week with no site changes at all. Profound captures answers through the browser the way a user sees them, and those answers vary run to run. Single-week movement is usually noise. Don’t report on anything under a full week of data, and use 4-week rolling averages after that. |
Pass Four: Engine-Level AI Visibility
The overall number blends engines that work differently. ChatGPT, Perplexity, Gemini, Google AI Overviews, AI Mode and Claude each pull web information their own way, from different search indexes and with different source preferences. A brand can score well in one and barely register in another. That gap decides where you spend effort, so the engine-level view is a key deliverable from Step 1.

| Key takeaway: Your baseline is one number per engine. The gap between those numbers is the first finding in the audit. |
Step 2: Map Your Prompts to Funnel Stages
Every number in Profound is downstream of your prompt list. Most teams accept the 10 to 15 onboarding prompts and never touch them. That sample is too small to mean anything, and it usually skews toward queries that flatter the brand.
Here’s the prompt set methodology we use:
1. Start from real demand. Profound’s Prompt Research Reports are built on more than 1.5 billion real user prompts from ChatGPT, Gemini, Perplexity and Claude. Start there. Then layer in your own inputs: sales and support conversations, reviews, keyword clusters and competitor terms.
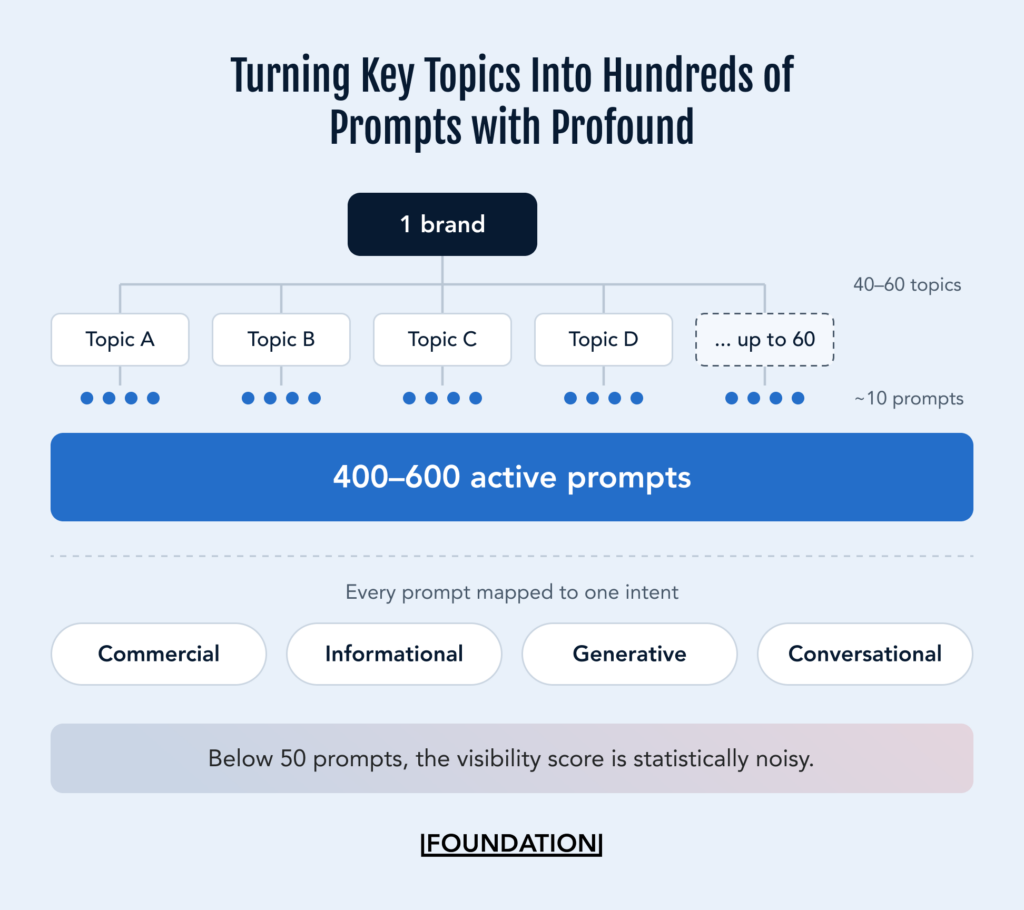
2. Target 400 to 600 active prompts per brand. Below 50 prompts the visibility score is statistically noisy. The working formula is 40 to 60 topics at roughly 10 prompts each, nested as category, then topic, then prompt, then tag.
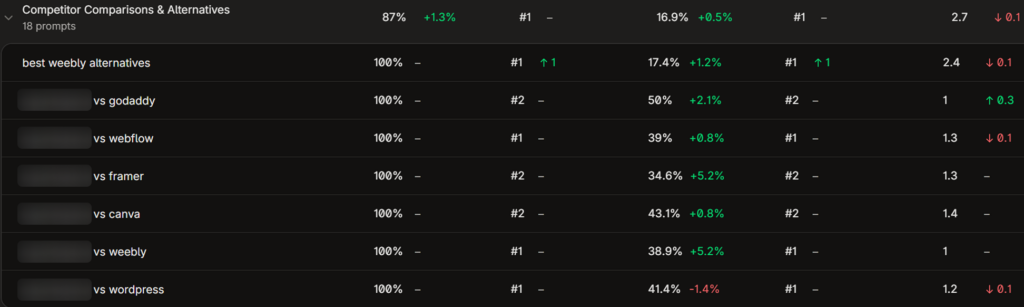
3. Wall off branded prompts. “Is [Brand] a good provider?” inflates an aggregate score, so it can’t sit loose in the general set. Give branded prompts their own topic and tag. Unbranded prompts measure visibility. Branded prompts measure what engines say once you’re named, which feeds Profound’s Sentiment and FactCheck reports.
4. Diversify across intent axes. Mix modifiers (best, cheapest, top, compare, alternatives), personas (by role or seniority), niches (by industry or use case) and geography (state or city level, where you sell locally).
|
Pro Tip from Foundation Strategist Tanya Desai: Visibility and Share of Voice move sharply with the ICP your prompt set targets. The same brand can read 40% against prompts phrased the way an SMB owner asks and 8% against prompts phrased the way an enterprise procurement lead asks, because the engines return different sources for each. Neither number is wrong. They answer different questions. A visibility score only means something next to the audience it was measured against. If you sell to more than one buyer, segment the prompt set by persona and read the scores separately. An aggregate across two ICPs describes nobody. |
5. Validate every prompt in Prompt Volumes. Drop anything under 100 monthly prompts unless it’s strategically critical. Above 500 is worth tracking. Above 5,000 is a priority. If your space returns no volume data, fall back on your own demand signals: search volume for the closest keyword equivalent, how often the question comes up on sales calls, and what support tickets cluster around.
6. Tag each prompt to a funnel stage. Profound’s Conversation Intent sorts conversations into Commercial, Informational, Generative or Conversational/Other. It then splits commercial conversations by stage: Awareness & Discovery, Consideration & Evaluation, Purchase Intent, and Support & Usage. A keyword at 80% commercial intent is a buying conversation and needs product and comparison pages. The same keyword at 80% informational intent needs a guide. That mapping is what makes Prompt Volumes more useful than Google search volume.
7. Review monthly, adjust quarterly. Each month, cut prompts returning irrelevant results and add prompts for growing topics. Each quarter, adjust for upcoming launches and new segments. A prompt set that doesn’t move with the roadmap goes stale.
Validate every prompt in Prompt Volumes. Drop anything under 100 monthly prompts unless it’s strategically critical. Above 500 is worth tracking. Above 5,000 is a priority. If your space returns no volume data, fall back on your own demand signals: search volume for the closest keyword equivalent, how often the question comes up on sales calls, and what support tickets cluster around.
Tag each prompt to a funnel stage. Profound’s Conversation Intent sorts conversations into Commercial, Informational, Generative or Conversational/Other. It then splits commercial conversations by stage: Awareness & Discovery, Consideration & Evaluation, Purchase Intent, and Support & Usage. A keyword at 80% commercial intent is a buying conversation and needs product and comparison pages. The same keyword at 80% informational intent needs a guide. That mapping is what makes Prompt Volumes more useful than Google search volume.
Review monthly, adjust quarterly. Each month, cut prompts returning irrelevant results and add prompts for growing topics. Each quarter, adjust for upcoming launches and new segments. A prompt set that doesn’t move with the roadmap goes stale.
Tagging is what makes the set usable after you’ve built it. An untagged prompt list gives you one number. A tagged one lets you ask which kinds of prompts you’re losing.
We tag every prompt on four dimensions, so you can filter on any one of them in a click:
- Brand status. Does the prompt name you, a competitor, both, or nobody? Unbranded prompts measure whether engines find you. Branded ones measure what engines say once they have.
- Funnel stage. Set this from Conversation Intent. Awareness and informational prompts are top of funnel, consideration and evaluation are mid, purchase intent is bottom.
- Prompt shape. Best-of, comparison, how-to, feature, use-case. This one pays off in Step 4, because best-of and comparison prompts carry the highest commercial value in most categories.
- Owner. Which team is accountable for moving it: brand, growth, or product.
Watch for: Anything you didn’t type in by hand is modeled. Auto-generated prompts are variations Profound writes around a topic. Prompt Volumes are estimates built by applying probabilistic modeling to licensed conversation data. Treat volumes as directional and prompts as representative.
A tagged prompt ends up looking like this. “Best AP automation software for mid-market finance teams” is unbranded, bottom of funnel, best-of shape, owned by growth.
Profound’s own Prompt Playbook goes further and adds a campaign dimension. Ask your rep for a copy.
| Key takeaway: 400 to 600 prompts across 40 to 60 topics, branded prompts walled off from your visibility numbers, every prompt tagged to a funnel stage. That is a prompt set you can build a strategy on. |
Step 3: Find Your Citation Gaps and the Sources Engines Trust
This is the step that turns a visibility number into a to-do list. If your own domain doesn’t appear in the top 20 cited sources for your own category, that is usually the highest-leverage finding in the whole audit.
Read the citation data as a diagnostic layer:
- Sort citation sources by frequency. The top 20 tell you who the engines trust in your category.
- Read the composition as well as the names. Profound groups cited domains into categories like Owned, Competition, Earned Media, Institution and Social. If Reddit, G2 and two niche blogs dominate, your playbook leans on community and reviews.

- Segment by engine before recommending anything. Otherwise, you may push a channel the engine you care about has stopped citing.
- Check the long tail per publisher. Usually, only the top eight to ten pages on a publisher carry meaningful citation share. That tells you which format to ask for when you negotiate a placement.
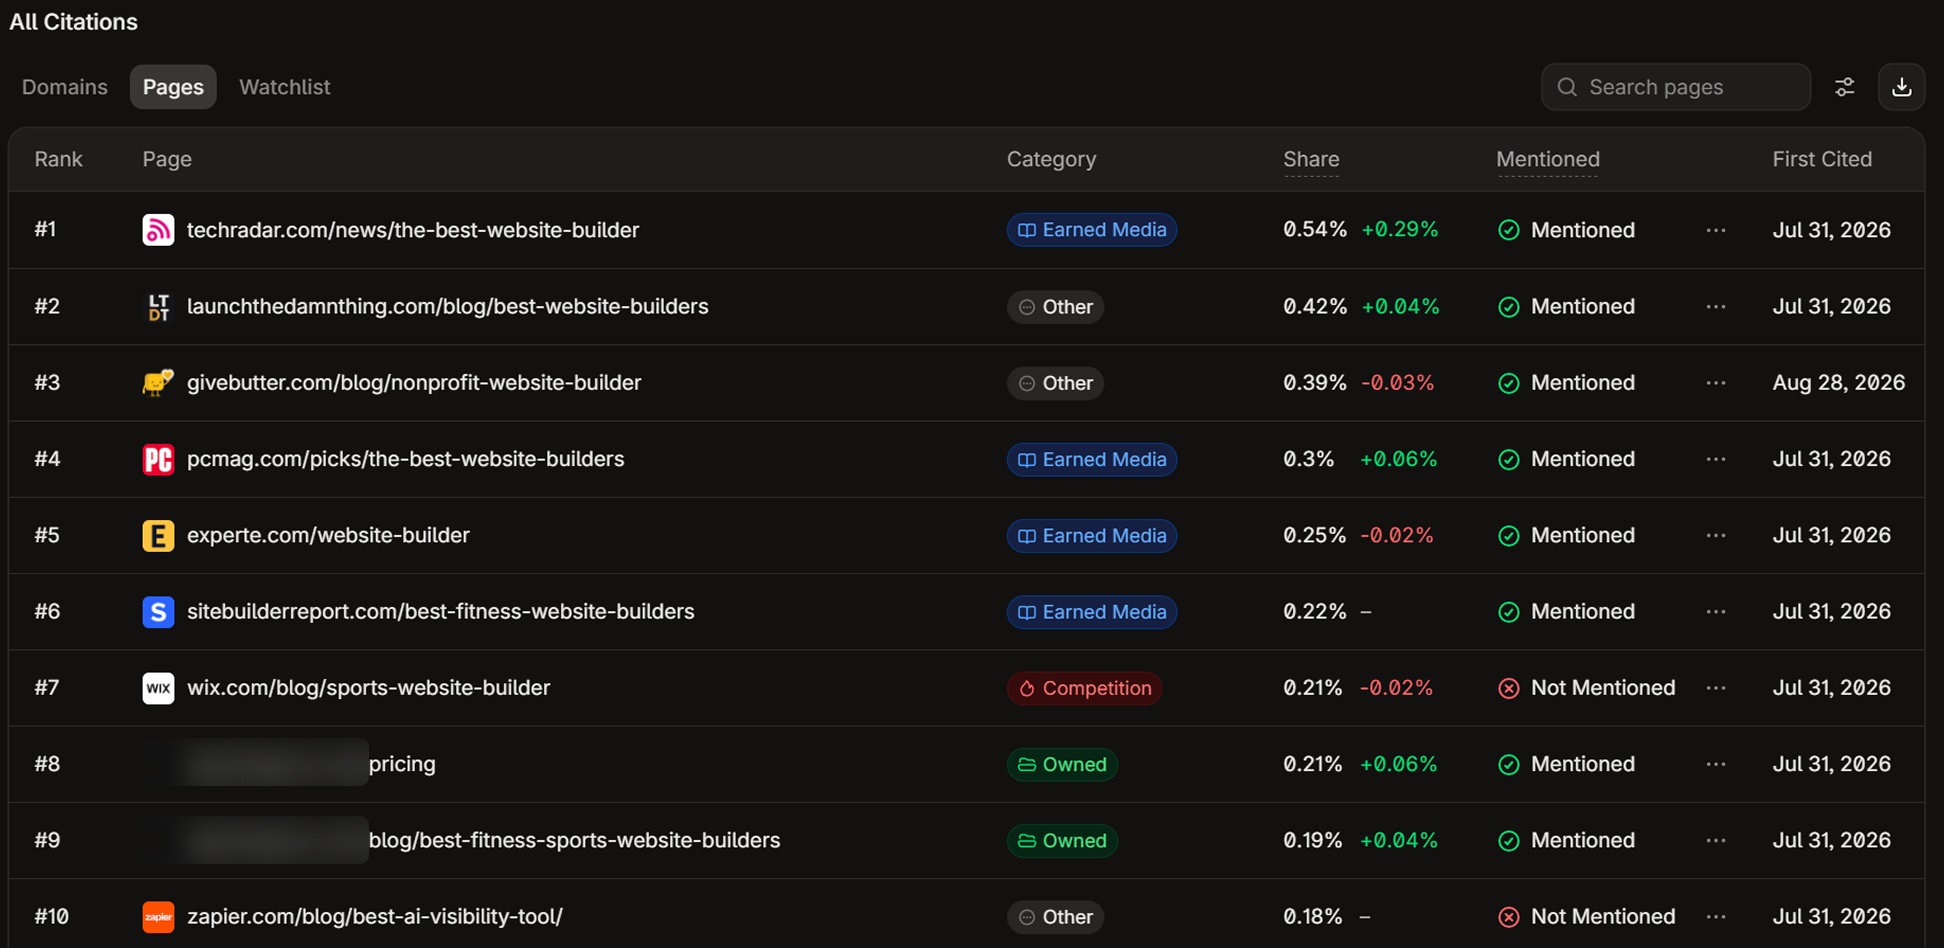
- Reverse-engineer competitor pages in the top 20. If the top five cited sources for a prompt all lead with a comparison table in the first 300 words, you have your brief.
For many of our B2B SaaS clients, Reddit threads are a key contributor to citation gaps.
The Reddit Citation Workflow
Reddit’s citation share varies a lot by category. In the citations screenshot above, it sits fourth. In our research with AirOps, it was the most-cited third-party source across B2B prompts, at 20.8% of third-party citations. Check where it lands in yours before you build a plan around it.
Here’s how our strategy team qualifies Reddit opportunities:
- In Answer Engine Insights, open the Citations tab and filter Top Citation Pages for “reddit”. Export to CSV.
- Clean the export down to a list of URLs.
- Run each URL through your SEO tool (prepend www. to the Reddit URL or you may not get the data).
- Pull organic traffic estimate, ranking keywords, SERP positions and subreddit for each thread.
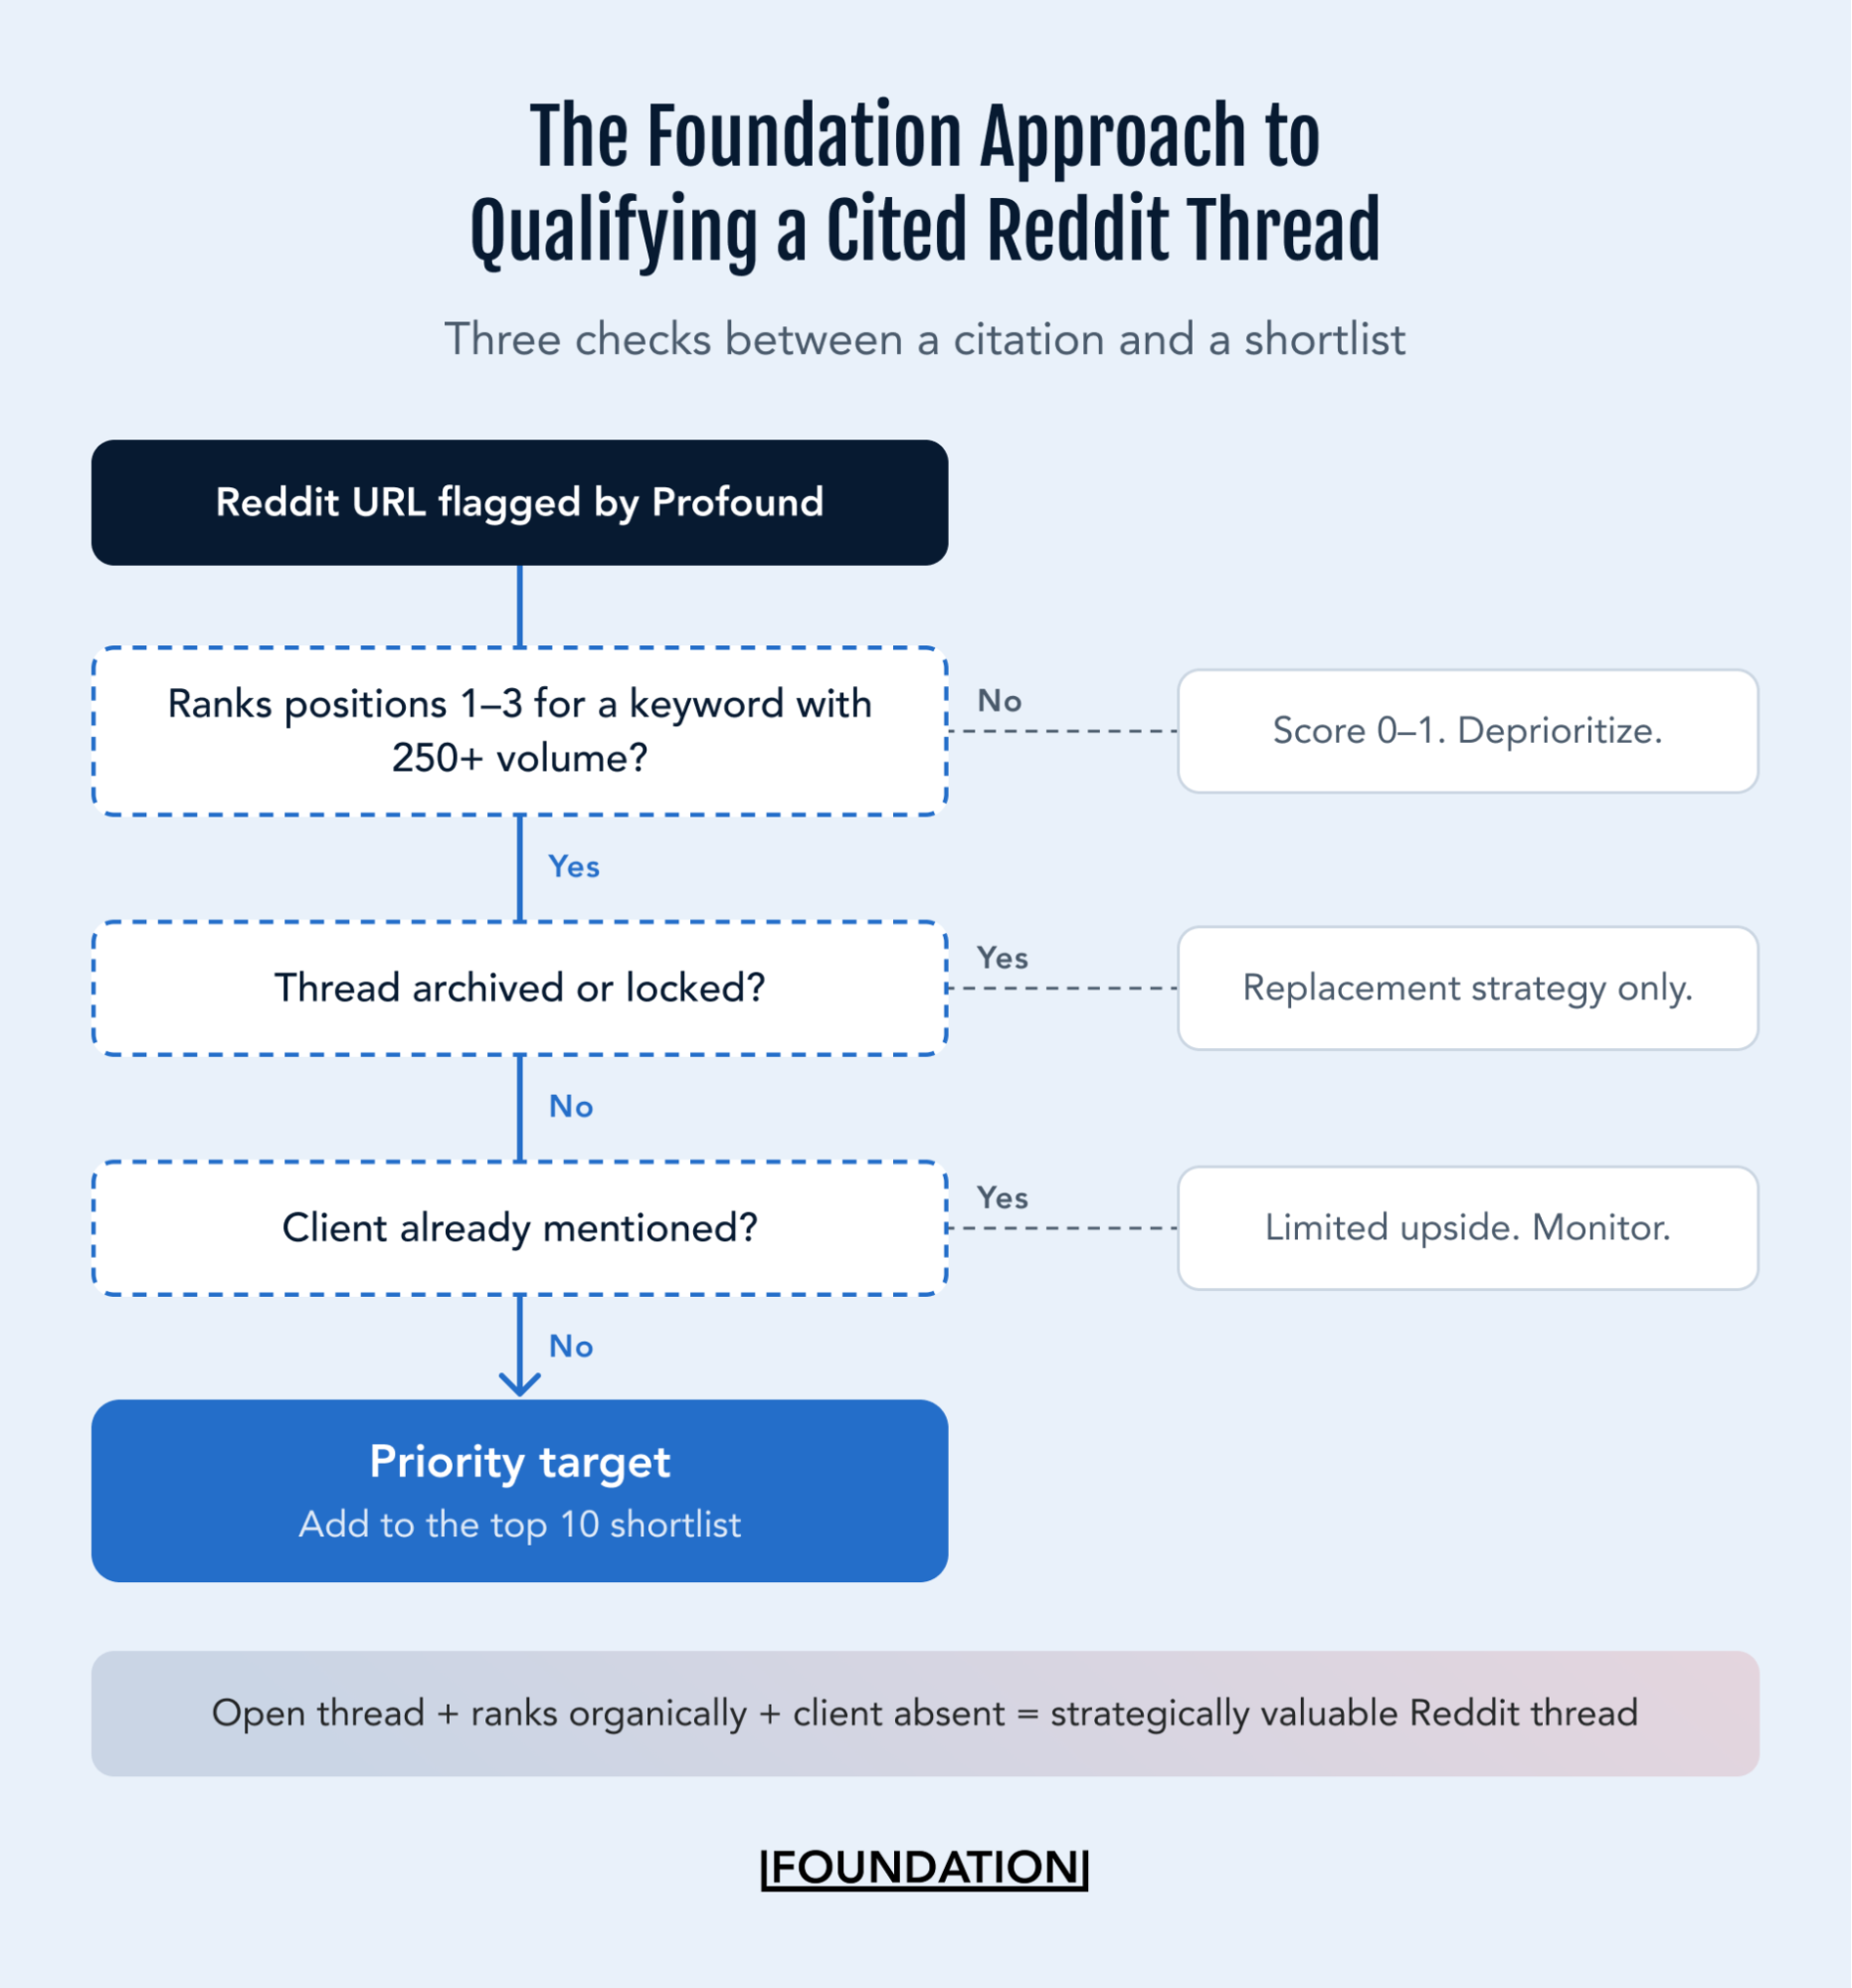
- Score each thread from 0 to 3. A 3 is high value: it ranks in positions 1 to 3 for relevant keywords with 250 or more monthly searches. A 2 ranks on page one but below position 3, or ranks in the top three for a keyword under 250 searches. A 1 or 0 ranks poorly, draws little traffic, or sits in a subreddit your buyers don’t read. Shortlist the 3s. Work the 2s when you run out of 3s.
- Open every high-value thread and check two things. If it’s archived or locked, you can’t engage, and only replacement strategies are open to you. If the thread already mentions your brand, the upside is limited. If neither applies, it’s a priority target.
- Shortlist the top ten open, well-ranking threads where your brand doesn’t appear yet.
These threads do double duty. LLMs cite them and they rank in traditional search, so a single contribution gets counted twice.
Watch for: Reddit is a community you take part in. Threads get removed and accounts get banned, and a brand that only shows up to sell gets treated accordingly. Budget for genuine presence over months.
| Key takeaway: Citation analysis turns a bad visibility score into a named list of pages and threads to go after. Skip it and every recommendation downstream is a guess. |
Step 4: Prioritize Fixes by Revenue Impact
Step 3 produces more work than any team can do in a quarter, and every other guide stops there. Volume-based prioritization pushes you toward top-of-funnel prompts where you win visibility that never converts.
Advertisers have already priced the commercial intent of every keyword in your category, and that pricing sits in your SEO platform. Use the CPC data in Semrush, Ahrefs, or your other platforms as a stand-in for revenue impact instead of guessing.
- Map each tracked prompt to its closest keyword equivalent in your SEO tool.
- Pull the CPC for that keyword.
- Multiply the CPC by the prompt’s monthly volume from Prompt Volumes. If your space has no volume data, use the search volume of the closest keyword instead.
- Index against the highest-scoring prompt so the top one is 100. The raw product is a large, meaningless number. Indexed, it’s a clean ranking you can defend.
- Filter to prompts where the brand is absent from the answer, or present but positioned poorly.
- Sort descending. That is the fix list, in order.
If leadership wants a dollar figure, we multiply CPC by 4 before point 3. Our logic: AI compresses the buying journey into fewer answers, so each prompt you win carries more weight than a single search click. That 4x is a working assumption, and because it applies to every prompt, it doesn’t change the order.
Intent tiers, roughly:
| Prompt shape | Typical CPC | Priority |
| “best [category] software”, “[X] vs [Y]”, “[X] alternatives”, “[X] pricing” | High | Fix first |
| “how to choose a [category] tool”, “[category] for [use case]” | Medium | Second wave |
| “what is [category]” | Low | Volume play only |
A prompt like “best procurement software” carries a much higher CPC than “what is procurement software”. Both may be high volume. Only one sits next to a purchase decision.
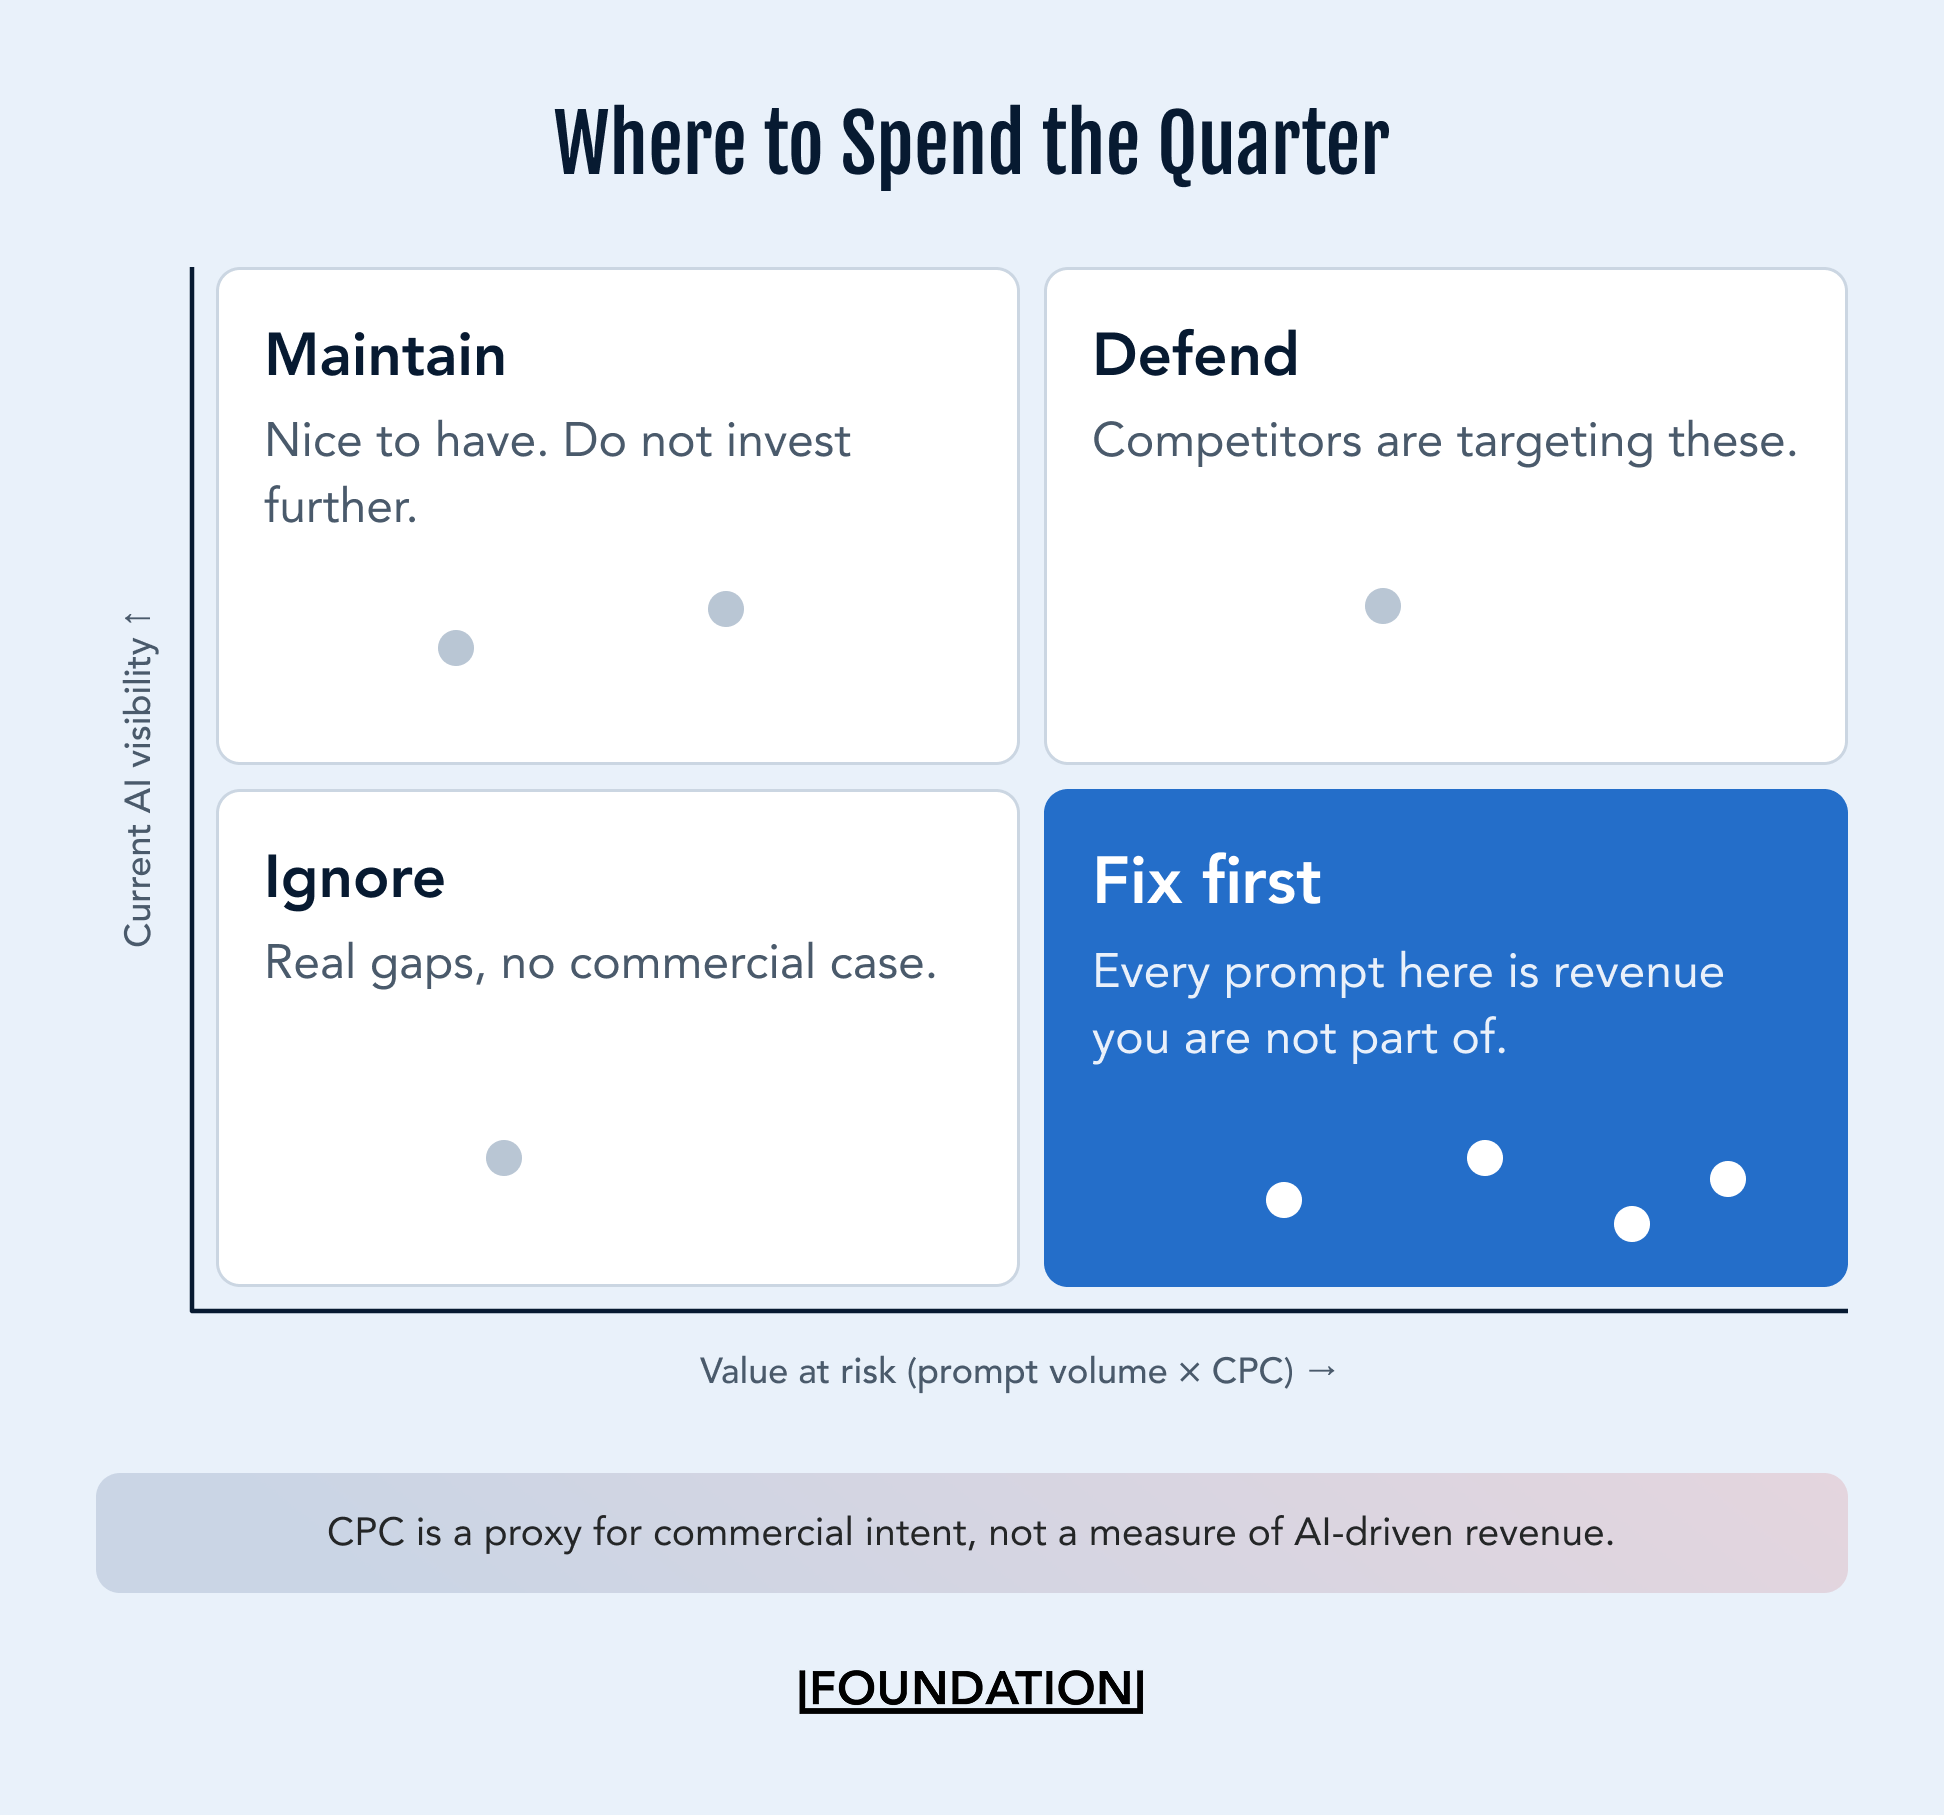
Watch for: CPC is a Google auction signal. It’s a proxy for commercial intent and it doesn’t measure AI-driven revenue. Treat it as the best ranking input available until AI referral conversion data is dense enough to replace it. For most brands, it isn’t yet.
| Key takeaway: Rank the fix list by prompt volume multiplied by CPC, filtered to prompts where you’re absent. Highest number first. |
Step 5: Measure Movement Monthly
Reporting cadence is where a lot of AEO programs lose credibility. Weekly reporting on a metric that swings 5 to 10 points a week makes a working program look broken and risks budget cuts before the work has time to land.
Our strategy team delivers monthly reports that include:
- Visibility by topic: where the brand is strong and where it is weak, subject by subject.
- Prompt gaps: prompts where the brand appears in none of the answers.
- Citation gaps: sources winning in your category that the brand is absent from.
- Competitive position: Share of Voice against named competitors.
On point 4, brands often set a goal of being number one in visibility. Share of Voice is frequently the better target. It accounts for how crowded the category answer is, on top of whether you show up at all.
The engine-level view from Step 1 shapes the plan. Add it to the monthly report once you know which prompts carry commercial weight. Before that, it’s detail with no decision attached.
Four numbers tell you the program is actually moving:
- Share of Voice against named competitors
- Citation share for your own domain
- AI referral traffic, from Agent Analytics or your analytics platform
- Positive sentiment on branded prompts
The cadence rule: Monthly, on a 4-week rolling average. Never a single week. Anything faster is noise and anything slower is too late to act on.
Those four live in Profound. The metric your CFO will eventually ask for does not.
AI-assisted revenue, meaning pipeline and closed deals that touched an AI answer somewhere in the journey, gets stitched together in GA4 and your CRM. It needs AI referral traffic landing in GA4 as its own channel instead of being lumped into direct, and it needs those sessions tied back to opportunities in the CRM. Most brands don’t have that wired up yet.
| Key takeaway: Report monthly against named competitors and judge the program on its quarterly trend. One good or bad week tells you nothing. |
Executing on Your Profound AEO Strategy
Profound benchmarks and continuously tracks how your brand shows up (or doesn’t) across your priority topics. It’s your marketing team’s job to close the gaps and solidify your position.
Profound shows brands where they stand today. Our job is to improve where they stand tomorrow. Clients can see where they started, track progress over time and invest with confidence because every strategic decision is backed by data.
– Ross Simmonds, CEO of Foundation
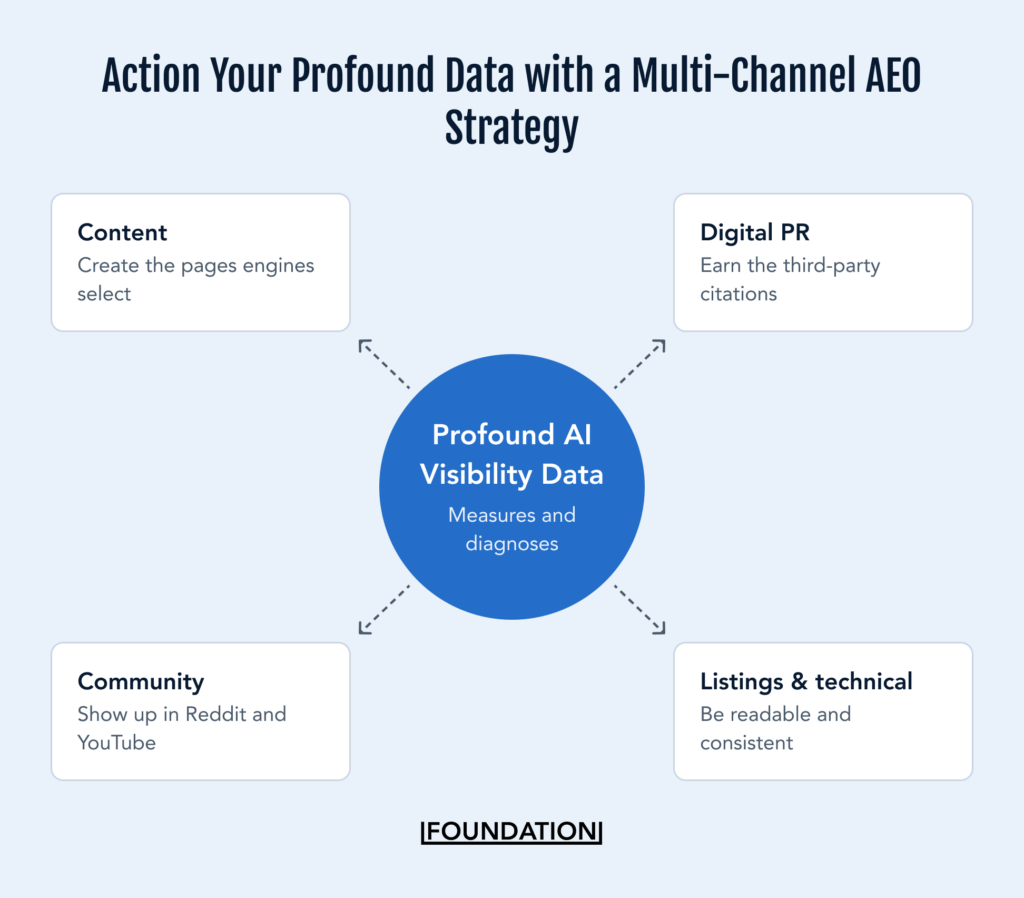
Profound has added agents that can draft briefs and content from the data, which speeds up one workstream. But a lot of what moves citations still happens off your website: earned placements, community presence, review profiles and site fixes. Below are the four workstreams we run on top of the tool, each mapped back to the citation data from Step 3.
AEO Content
The citation data dictates the structure. Engines favor pages that make answers easy to lift: comparison tables, a direct answer in the first 100 words, question-shaped headings, semantic URLs and depth on the specific sub-questions they fetch.
Those sub-questions are visible. Profound’s query fanout data shows the searches an engine runs behind a single prompt. Each one is a question your page should answer.
AI can speed up production. It can’t supply your proof points or a point of view the model hasn’t already absorbed from everyone else in the category. That part still comes from people who know the product and the buyer.
Digital PR and Earned Media
You can’t solve AEO on your own domain. In our research with AirOps, brand-owned domains made up 10.15% of AI citations for B2B SaaS. In unbranded discovery queries, that fell to 2.24%.
That makes earned placements the core of the work. Target the publishers already sitting in your top 20, and pitch the page formats already carrying citation share there.
Original research works especially well. It creates a citable claim that other sources repeat, and every repeat adds to the next.
Community
Reddit and YouTube are the two highest-leverage social surfaces in AI citation data, Reddit especially. The workflow in Step 3 tells you which threads matter. Taking part in them is a different kind of work from content marketing. It needs accounts with real history and people with subject-matter expertise. Expect moderation.
For Bitly, we ran a Reddit-first program for 12 months. Bitly reached 11.7% category citation share for link shorteners, nearly double the next competitor. Eight r/Bitly threads were cited in Google AI Overviews, four of them in position one.
Listings, Structured Data, and Technical
Keep your entity details consistent across directories and review platforms. Review sites like G2 and Capterra show up in B2B citation data constantly. In our analysis of G2’s AI footprint, nearly 80% of the top 1,000 keywords where G2 appears in AI Overviews carry commercial intent. Add schema markup so engines can parse who you are and what you sell.
Then check whether AI crawlers can read your site. Vercel’s crawler analysis found that none of the major AI crawlers, including GPTBot, OAI-SearchBot, ClaudeBot and PerplexityBot, render JavaScript. Gemini was the exception because it runs on Google’s infrastructure. Client-side rendered pages are often invisible to the rest. Agent Analytics shows which crawlers reach your pages and which don’t.
The quickest win is often in robots.txt. A rule written in 2019 that blocks an AI crawler is a ten-minute fix that moves visibility scores within weeks. It’s one of the most common findings in the audits we run.
| Key takeaway: Profound tracks visibility across your target prompts and shows you the gaps. Closing them takes a team that can execute across four workstreams. |
Ready to Close Your AI Visibility Gaps?
AEO strategy is a loop: baseline, map, diagnose, prioritize, measure, then run it again next month. Profound is the instrumentation. The strategy is the five steps plus the four workstreams you run on top of them.
The brands getting cited and recommended in AI answers right now started measuring before they had the answers. The longer you wait, the more of your category’s answers get written without you.
If you’re ready to identify and close your visibility gaps with the leading AEO tool, we can help. As a verified Profound Partner agency, our strategists can help you through each of the steps we’ve walked through today.
Whether you’re just getting started or want a second set of eyes on your Profound space, get in touch for an AI visibility audit that shows where your brand stands across engines and which gaps to close first.
FAQs
What is Share of Model?
Share of Model measures how often a brand appears in AI-generated answers for category prompts across engines like ChatGPT, Perplexity, Gemini and Google AI Overviews. It’s the AI-era version of market share: whether a model includes you in its consideration set. In Profound, the closest equivalent is Visibility Score.
Is AEO the same as GEO?
They are interchangeable. AEO (answer engine optimization) and GEO (generative engine optimization) both describe the work of getting your brand cited and recommended inside AI-generated answers. Different people and different tools picked different labels for the same discipline. You will also see AI SEO, AI search optimization and LLMO used the same way. Pick one and stay consistent internally, because the difference is vocabulary rather than method.
How many prompts should you track in Profound?
Between 400 and 600 active prompts for a full program, organized as 40 to 60 topics at roughly 10 prompts each. Below 50 prompts the visibility score is statistically noisy. The default 10 to 15 onboarding prompts are a starting point. Keep branded prompts in their own topic.
How long does AEO work take to show up in visibility scores?
AI visibility requires a holistic, multi-channel approach and some channels produce results faster than others. Technical fixes such as unblocking a crawler can move scores within weeks. Content, community, and earned media typically take one to two quarters, because engines have to find the new sources and start choosing them. Use 4-week rolling averages and judge on the quarterly trend.

