



Article's Content
Article's Content
AEO KPIs show whether AI engines mention, cite, and recommend your brand, and whether that turns into pipeline. Track five: visibility, citation share by engine, sentiment and accuracy, AI referral traffic, and AI-assisted pipeline.
Your team already pays for a tool that tracks AEO metrics and hands you visibility scores every week. Then the quarterly report is due, and leadership asks: What did this actually do for pipeline?
Your tracker can’t tell them. Similarweb found that AI referrals still make up a small share of overall website traffic, so on the dashboard that sets your budget, AI looks like a small channel, even while your visibility scores rise.
This guide breaks down five AEO KPIs, each with a definition, measurement method, benchmark where available, and recommended tool. Together, they form a chain: the first two show whether AI includes you, the third checks what it says about you, and the last two show what that visibility is worth, giving leadership a pipeline figure that ties visibility to revenue.
Key Takeaways
- Track five AEO KPIs as one chain. Visibility score and citation share by engine show whether AI includes you, sentiment and accuracy check what it says about you, and AI referral traffic and AI-assisted pipeline show what that visibility is worth.
- Report citations by engine. A strong AI Overview result can hide a ChatGPT gap.
- Few public benchmarks exist. Benchmark the answer-based KPIs against your top competitors, and track the 90-day trend for all five.
- AI referral traffic undercounts AI’s influence. Read it alongside self-reported attribution and branded search.
- Analytics should own the measurement method and the data, separate from the teams doing the work, and the AEO lead should report the results to the CMO.
What Are AEO KPIs, and How Are They Different From SEO KPIs?
AEO KPIs, also called AEO metrics, measure whether AI engines mention your brand, cite your pages, and describe your product accurately. They also track identifiable AI referrals and opportunities with documented AI discovery.
A buyer can discover you in an AI answer and arrive later through branded search. SEO reporting shows where your pages appear in search and the visits they receive. Your SEO report captures the visit, but not the earlier recommendation. Generative engine optimization needs both views.

The five KPIs cover four dimensions of AEO performance. Presence and prominence show whether AI includes you, perception checks what it says about you, and performance shows what that visibility is worth.
| Dimension | The question it answers | Relevant KPI |
| Presence | Does AI mention your brand? | 1. Visibility score |
| Prominence | Does AI cite your pages and place your brand near the top? | 2. Citation share by engine, with average position from KPI 1 |
| Perception | Does AI describe your brand positively and correctly? | 3. Sentiment and accuracy |
| Performance | Do buyers act on what AI tells them? | 4. AI referral traffic and 5. AI-assisted pipeline |
How to Track AEO Performance Using AI Visibility Tools
An AI visibility tracker such as Profound or Peec AI runs your priority prompts repeatedly and stores the answers and citations. Manual checks can’t provide that record at enterprise scale.
Collection method matters, too. Surfer’s August 2026 test of 1,000 prompts across five AI products found brand overlap as low as 15.5% between interface and API answers.
The study captured one answer per prompt for each method, so it shows that collection methods can produce different results, not how large that difference will be over time.
Check whether your tracker collects answers through the consumer interface or an API, and which engines it covers. Profound, for example, uses daily front-end tracking.
If you switch tools, run both over the same prompts and engines for an overlapping period, then note the switch in your report. Otherwise, differences between tools could look like changes in your brand’s performance.
Disclosure: Foundation is a verified Profound Partner.
The 5 AEO KPIs to Track in 2027
Use real buyer questions and three to five competitors for the answer-based KPIs, and keep that sample stable through the quarter. Add prompts for planned content before publication, so they have their own baseline. Taken together, these AEO KPIs show provide the data necessary to connect AI visibility to web traffic and pipeline.
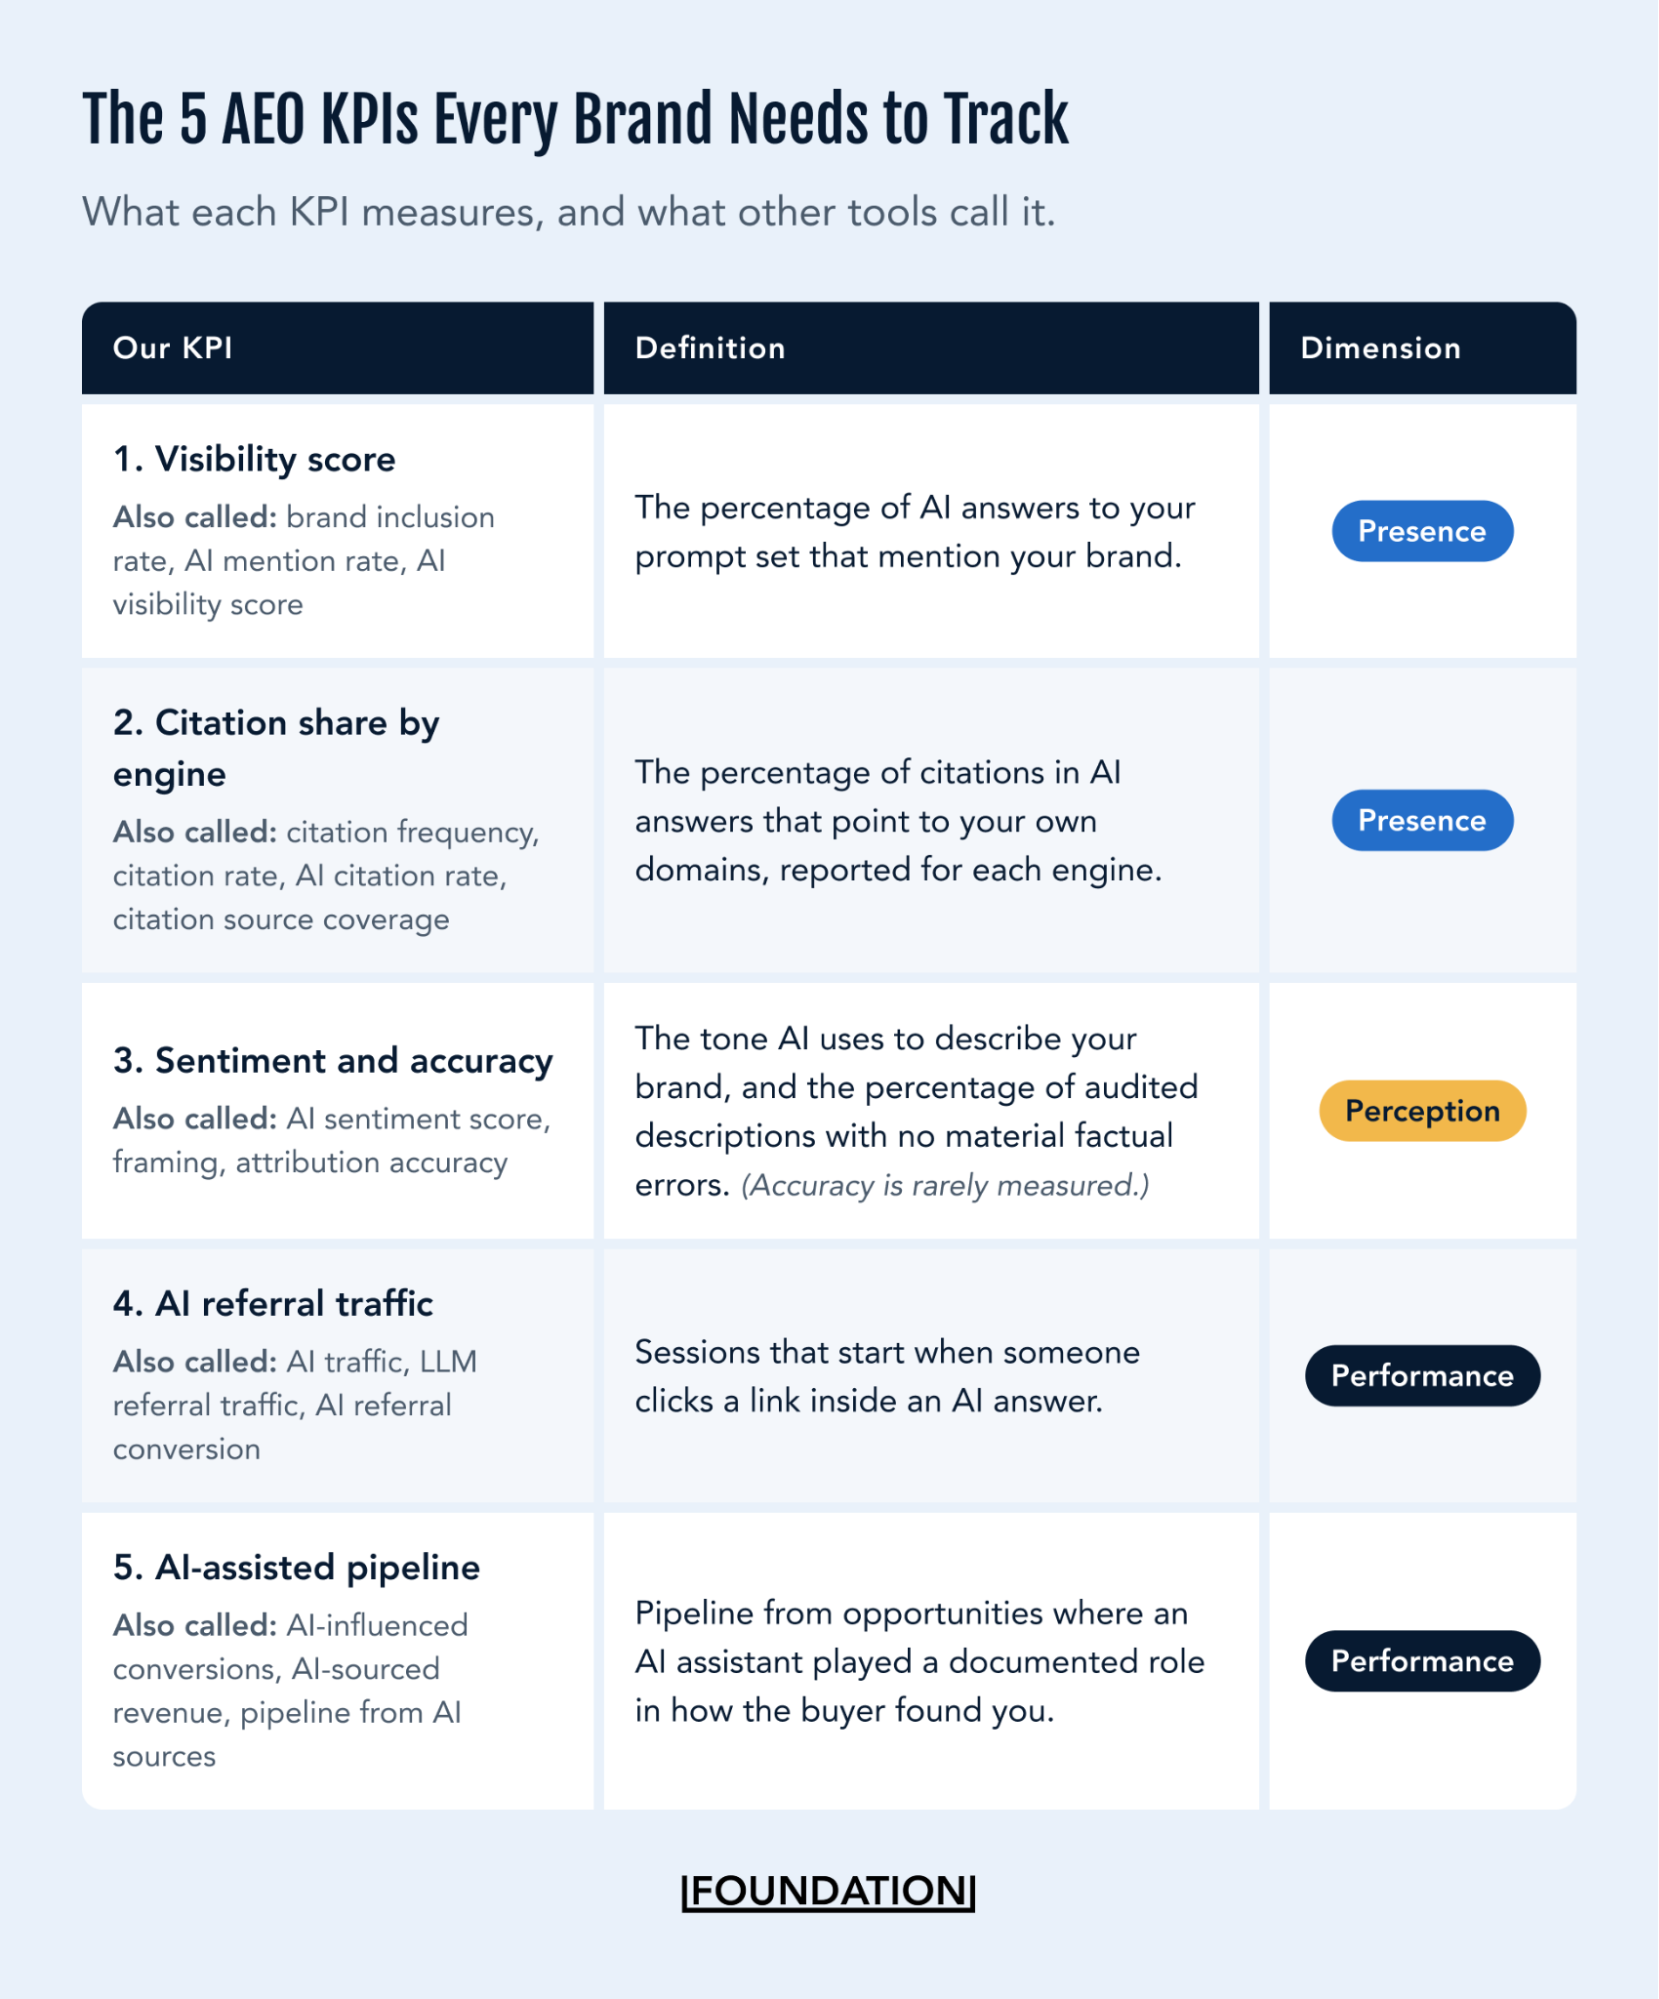
1. Visibility Score
Definition: Visibility score is the percentage of AI responses that mention your brand, out of all responses that mention at least one brand, as Profound defines it.
How to measure: Build your prompt set from the questions buyers ask AI when they research your category, such as “best [tool] for [use case].” We start each client with a small core set, phrased neutrally so the prompts don’t steer answers toward the brand, then expand it to hundreds of prompts over time. Because AI can answer the same question differently each time, trackers like Profound run each prompt repeatedly on each engine. For each engine, calculate:
- Visibility score = responses that mention your brand ÷ responses that mention at least one brand × 100
Visibility score shows how often your brand appears. Share of Voice adds the competitive context. Profound defines it as how often your brand is mentioned compared with all brands:
- Share of Voice = your brand mentions ÷ all brand mentions × 100
A brand can appear in half the answers and still hold a small Share of Voice if competitors are named more often in those same answers. Track both for each competitor on the same prompts. Neither metric shows how high your brand ranks in a recommendation list.
Clio illustrates why that matters. In Profound’s data, it appeared in 32.9% of ChatGPT answers and 47.8% of Gemini answers, roughly twice as often as its nearest competitor. Yet its average position was 3.2, meaning it ranked around third when included. Frequent mentions did not mean Clio led the recommendations.
When reporting visibility score, include average position so readers can see both how often your brand appears and how high it ranks in recommendations.
Starting benchmark: Across the B2B brands we track in Profound, starting Visibility Score ranged from about 20% to 74%. A spread that wide is why one industry number won’t tell you much: your benchmark is the leader in your own category. In the first 90 days, most held their position within a few points while their citation share grew, which is why we report the two together. Establish a 90-day baseline, then compare your Visibility with the category leader on the same prompts and engine. Track whether that gap narrows quarter over quarter.
Tool: Profound (our tool of record), Peec AI, Semrush AI Toolkit, HubSpot AEO, and Writesonic.
2. Citation Share by Engine
Definition: Citation share is the percentage of citations in AI answers that point to your own domains, reported separately for each engine.
How to measure: Keep AI citation tracking separate from brand mentions, because an answer can name your company while citing a competitor’s page. Count citation occurrences, where each URL an answer cites is one citation, and use that unit on both sides of the formula:
- Citation share = citations to your owned domains ÷ all citations in answers to your prompt set × 100, per engine
Include your site, blog, documentation, and help center in owned citation share. Track cited third-party coverage separately: a review discussing your brand counts; an unrelated category page doesn’t.
That split shows whether AI cites your information or other people’s descriptions of you. Report ChatGPT, AI Overviews, AI Mode, Perplexity, Gemini, Claude, and Copilot separately.
Our study with AirOps shows why that separation matters. Across about 380,000 AI answers collected in June and July 2026, review sites accounted for about one in five citations on Claude and Perplexity, compared with under one in ten on Google’s AI Overview and AI Mode.
These are source-mix figures, not targets for an individual brand, but they show how a blended result can hide engine-specific differences.
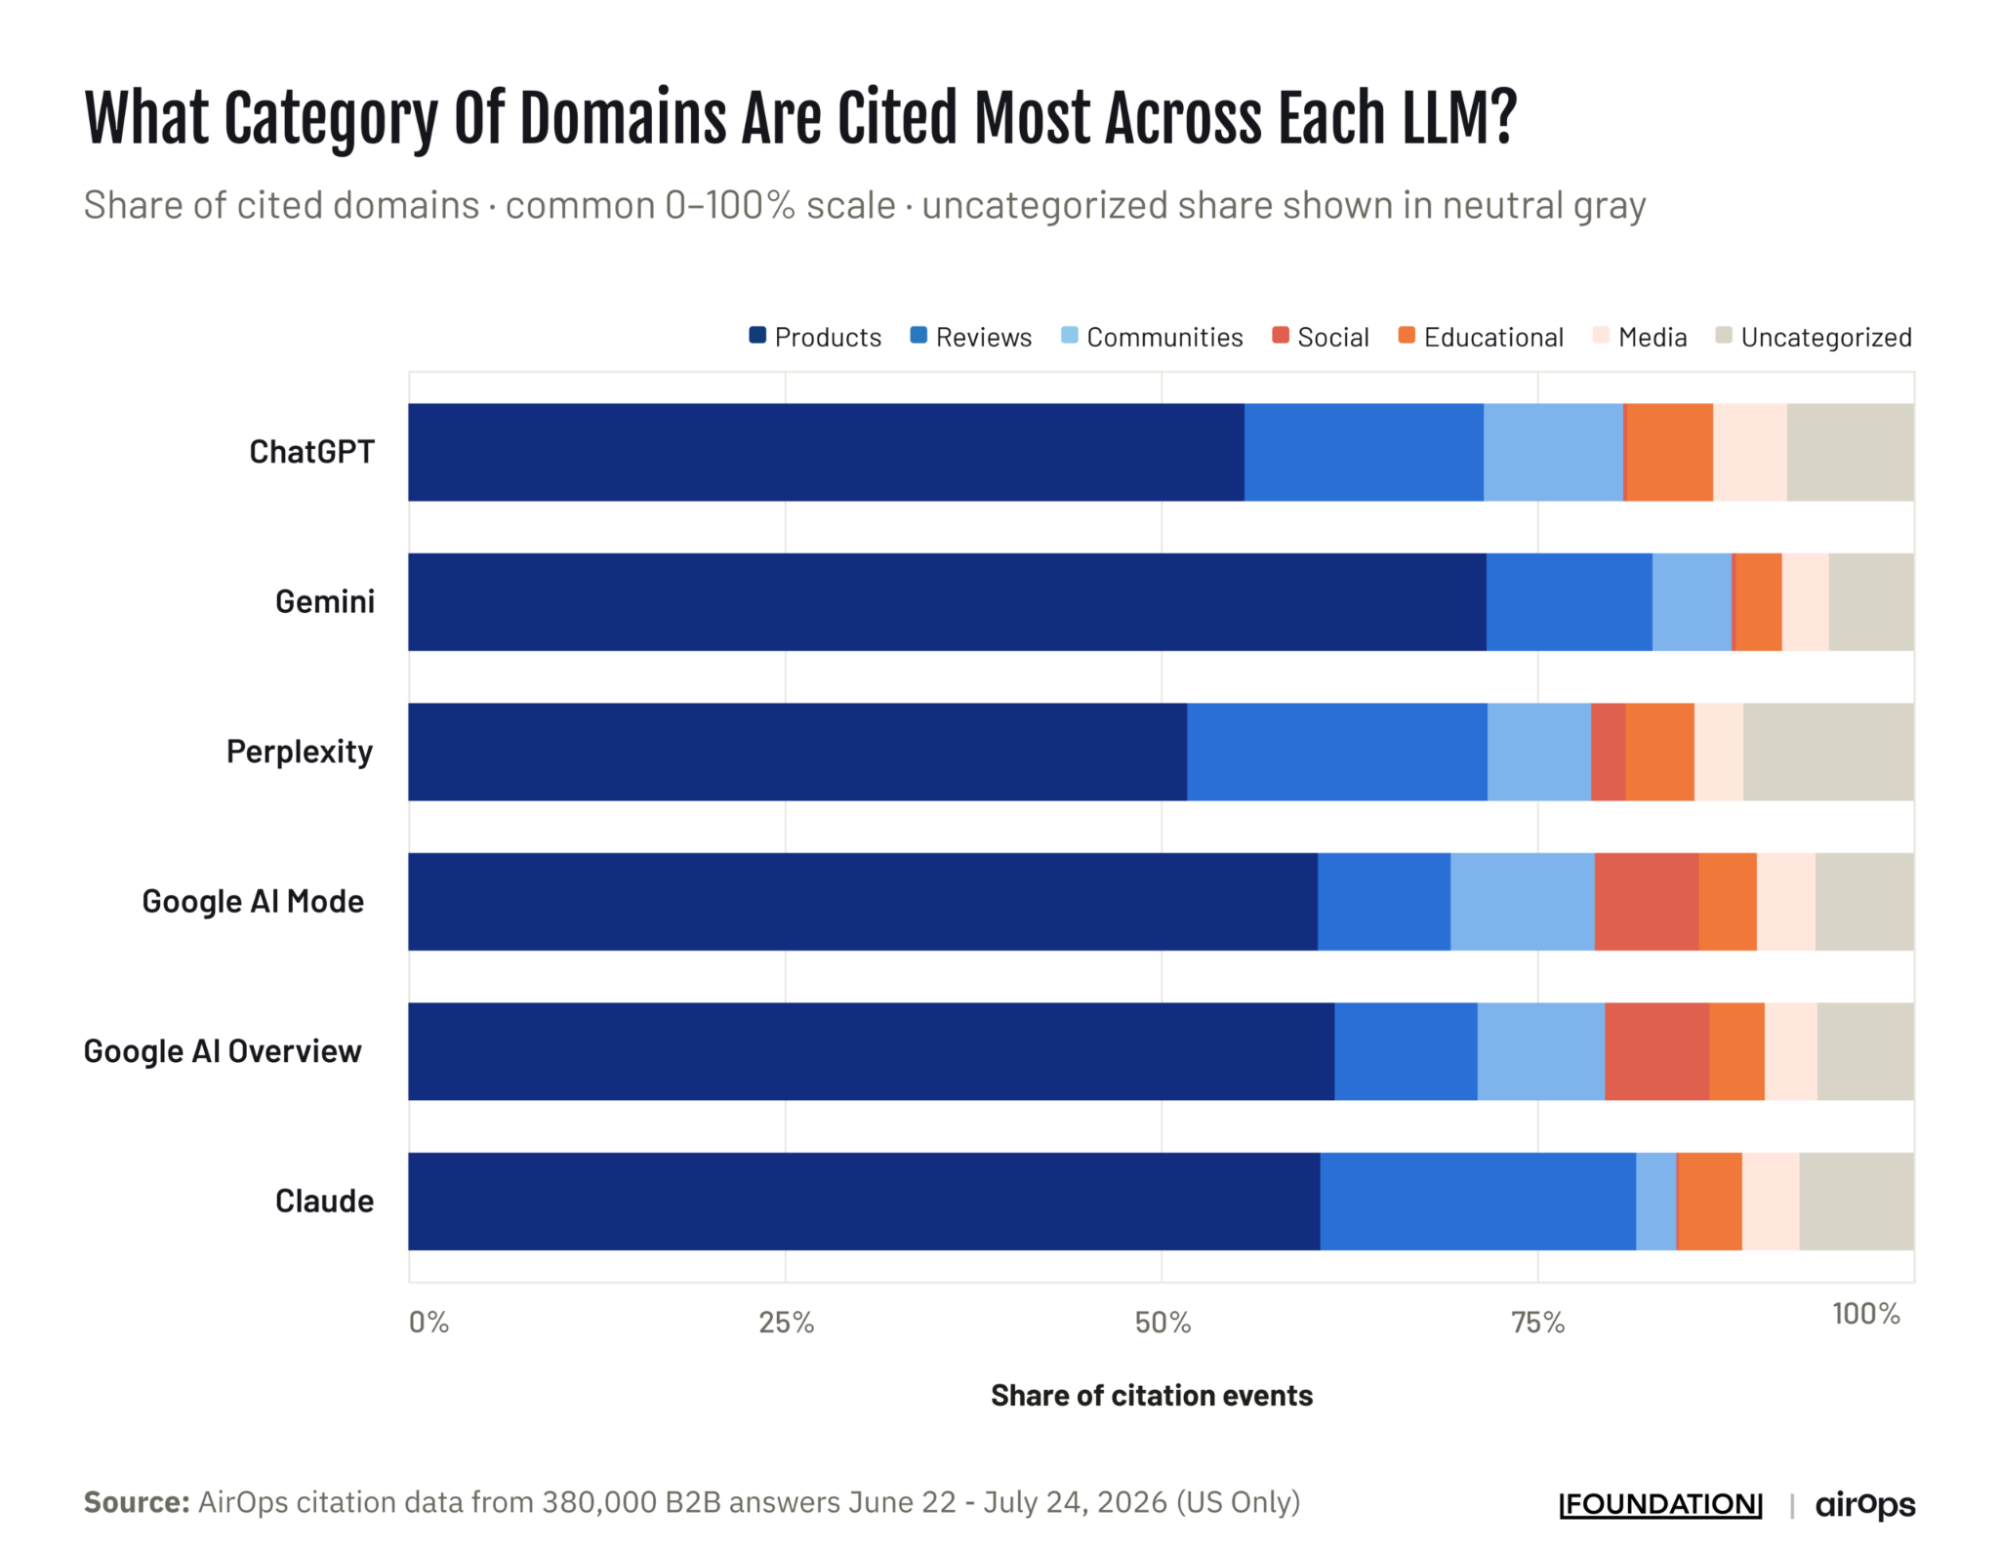
The engine split also helps the team decide which sources to investigate when visibility changes. “Split the plan,” says James Scherer, Foundation’s VP of Strategy. “Reddit, LinkedIn and YouTube are a Google-surface play, measured against AI Overview and AI Mode. Vendor pages and review profiles are how you show up in ChatGPT and Claude,” he adds.
Starting benchmark: Across the B2B brands we track, owned domains started at about 1% to 7% of all citations in answers to their prompt sets. Most grew that share in the first 90 days, several by 20% to 60% relative to their baseline, and some more than doubled it over the months that followed. Establish a 90-day baseline and compare your owned-domain share with competitors on the same prompts and engine. Keep the domain definitions and counting method consistent.
Tool: Profound, Ahrefs Brand Radar, HubSpot AEO, and Peec AI all report cited sources.
3. Sentiment and Accuracy of AI Mentions
Definition: Sentiment is the tone AI uses when it describes your brand. Accuracy is the percentage of audited brand descriptions that contain no material factual errors, where one brand description is everything a single answer says about you.
How to measure: A positive mention can still carry the wrong price or a retired feature, so assess sentiment and accuracy separately. Going back to our study with AirOps, we found average sentiment ranged from 80.91 on Perplexity to 69.05 on Claude, on a 0-100 scale.
A single sentiment score would conceal those differences. “Never report one AI sentiment number,” Scherer says. “Report per platform, fixed prompt set, fixed cadence.” Apply the same scoring method throughout.
Buyers can rule out your product because an AI answer gives them the wrong price or says a required integration is missing. A monthly accuracy audit helps catch those errors by comparing AI descriptions with a current fact sheet from product marketing covering pricing, features, integrations, customer fit and positioning.
The review prioritizes claims that could affect a buying decision. Material factual errors count against the accuracy rate, while differences in tone or preferred positioning are recorded separately.
- Accuracy rate = audited brand descriptions with no material errors ÷ all audited brand descriptions × 100
Keep an error log by engine, recording each incorrect claim and the sources cited. The hallucination rate is the percentage of audited descriptions with at least one material factual error. Use the log to decide whether to update your own pages, request a third-party correction or publish missing information.
Starting benchmark: Across brands we track, positive sentiment over the last 90 days ranged from about 69 to 95 on Profound’s 0–100 scale. In a client account where we run Profound’s fact-check tool, two-thirds of the recurring errors involved pricing or which features each plan includes. Target zero material errors on pricing and core features, and assign an owner to investigate each logged error. Compare sentiment with the same competitors, engine by engine.
Tool: Profound, Peec AI, and a shared error log.
4. Referral Traffic From AI Surfaces
Definition: AI referral traffic is the number of sessions that start when someone clicks a link inside an AI answer.
How to measure: Start with the sessions GA4 can identify. Its AI Assistant channel, now part of the default channel group, groups visits from sources such as ChatGPT, Gemini, DeepSeek, Copilot, and Grok, and it excludes Google’s AI Overviews and AI Mode. Check where visits from Perplexity and Claude land in your own property. If they sit in Referral, add a custom channel group with a rule such as perplexity\.ai|claude\.ai and place it above Referral.
Report landing pages and conversion rate by source alongside session volume. Assess the pages visitors actually reach separately from the URLs AI cites: in May 2026, homepages received 58.8% of ChatGPT referral traffic.
Published conversion figures vary. Semrush reported that AI search visitors were 4.4 times as valuable as organic visitors by conversion rate, while Amsive found no significant difference across 54 sites. Use those findings as context and measure your own rate.
Those sessions show what happened after an identifiable click. They don’t capture every buyer who encountered your brand in an AI answer. GA4 records AI Overview and AI Mode clicks as Google organic, and visits without an identifiable referrer as Direct.
Buyers can also discover you without clicking. Self-reported attribution can capture some of that discovery when they later contact you.
Starting benchmark: AI referrals are still a small share of overall traffic, but they’re growing fast. Similarweb found that AI referral traffic grew 237.3% in marketplaces and 236.5% in finance from June 2025 to May 2026, compared with the 12 months before. The report doesn’t break out B2B software, so treat those figures as context, not a target. Your own baseline is the share of sessions in your AI channel over your first full quarter.
Tool: GA4, with Microsoft Clarity’s AI platform channel as a second view.
5. AI-Assisted Pipeline
Definition: AI-assisted pipeline is the pipeline and revenue from opportunities where an AI assistant played a documented role in how the buyer found you.
How to measure: Agree on these four rules with RevOps and Analytics, then apply them consistently.
- Capture. Add “AI assistant (ChatGPT, Perplexity, etc.)” to the self-reported attribution field on your demo forms, and record AI referrals as touches in the CRM.
- Qualify. An opportunity counts as AI-assisted when the buyer selected or wrote in an AI assistant, or when the opportunity’s first recorded touch is an AI referral. Count each opportunity once, even when it carries both signals. AI touches later in an active deal stay out, because this KPI measures how the buyer found you.
- Calculate.
- AI-assisted pipeline = the total value of qualifying opportunities created in the reporting period
- AI-assisted share of pipeline = AI-assisted pipeline ÷ all pipeline created in the period × 100
- Follow through. Report closed-won revenue from those opportunities separately, as they close.
Docebo made “How did you hear about us?” mandatory on its demo forms and used LLMs to classify the responses. In Q3 2025, 12.7% of its high-intent leads named AI tools, roughly five times the previous year’s share. Link responses like those to opportunities to calculate pipeline.
Tally uses the same method. Its onboarding survey asks new users how they found Tally, and 43% now say they discovered it through an AI assistant such as ChatGPT, Claude, Gemini or Perplexity.
Self-reported attribution can capture discovery that first-touch tracking misses. In one B2B agency’s data, first-touch identified only 28 of the 189 leads buyers self-reported as AI-sourced.
Review branded search and direct traffic alongside documented opportunities, but keep them outside the calculation: neither identifies AI discovery on its own.
Starting benchmark: No public standard exists for an AI-assisted pipeline. Use your first full quarter as the baseline, then compare pipeline value and share in later quarters under the same qualification rules. State what the method excludes, including later AI touches and discovery with no recorded attribution.
Tool: Your CRM (HubSpot or Salesforce), your form tool and GA4. RevOps owns the attribution field and the qualifying rules.
How Should an Enterprise AEO KPI Framework Fit Together?
Visibility score and citation share are leading indicators of AI presence. Sentiment and accuracy are the quality check on that presence. AI referral traffic and AI-assisted pipeline are the lagging indicators, where the work shows up as visits and revenue.
Together, the first four point to one number leadership can act on: AI-assisted pipeline, the revenue you can attribute to AI discovery.
When buyers tell you, as Docebo’s and Tally’s did, that an AI assistant helped them find you, they connect visibility to revenue. Review all three groups over the same periods to see which number to act on first.
When pipeline doesn’t follow visibility, the groups show where the chain breaks:
- If mentions and citations rise but referrals don’t, check whether the answers link to you and where recorded visitors land.
- If referrals grow but opportunities don’t, check conversion on those landing pages and whether buyers are filling in the attribution field.
- If accuracy falls, investigate the wrong claims, whatever visibility is doing.
Check whether a change persists before treating it as a trend. Our study with AirOps also tracked a sharp shift in ChatGPT’s use of Reddit: the share of its answers citing Reddit fell from 21.41% in July to 10.05% in August 2026, even as answer volume held steady. Read movements like that over repeated runs and 90-day trends, not a single report, so leadership can tell short-term volatility from a sustained shift.
What Does an AEO KPI Dashboard Look Like?
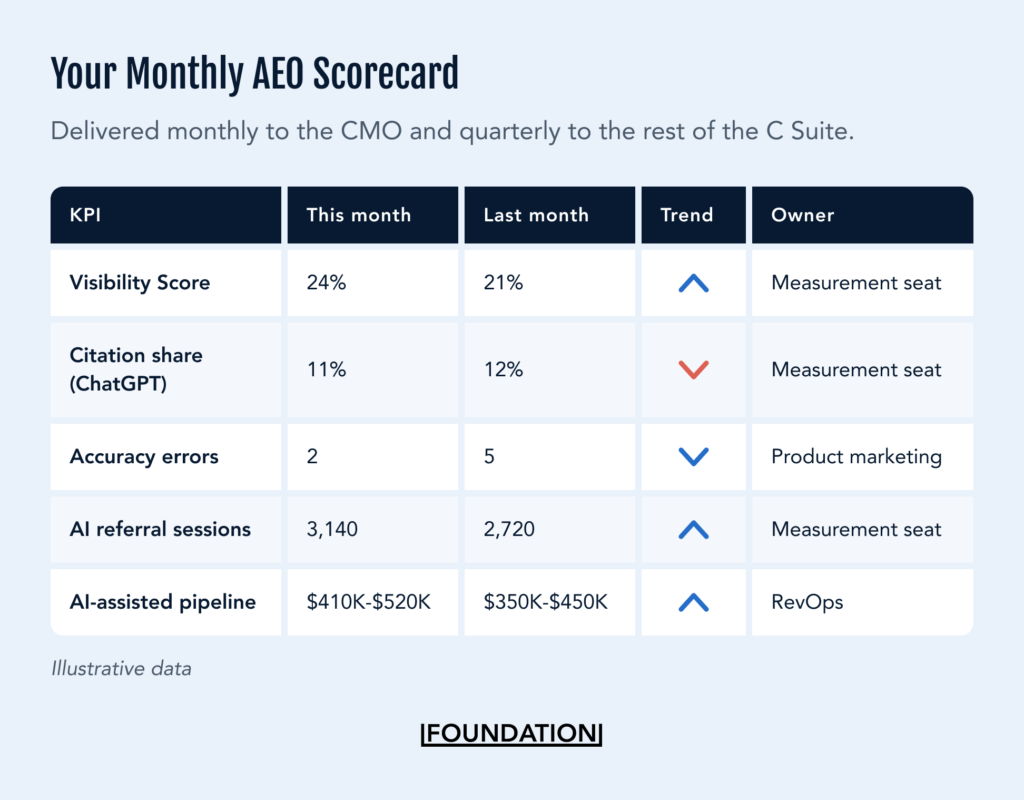
Use this table as your measurement specification: formula, sample, cadence, and benchmark. The scorecard then shows current results, the comparison period, and the engine split where relevant.
| KPI | Formula | Sample | Collect → review → report | Starting benchmark |
| 1. Visibility score | Answers that mention you ÷ answers that mention at least one brand × 100, per engine; Share of Voice (your mentions ÷ all brand mentions) as the competitive view | Locked prompt set, every engine | Collected daily, reviewed weekly, reported monthly | 90-day baseline; gap to the category leader |
| 2. Citation share by engine | Citations to owned domains ÷ all citations × 100, per engine, counted as citation occurrences; earned coverage and source mix as supporting views | Same prompt set | Collected daily, reviewed weekly, reported monthly | 90-day baseline against the same competitors |
| 3. Sentiment and accuracy | Sentiment: tool score per engine. Accuracy: audited brand descriptions with no material errors ÷ all audited brand descriptions × 100, counting factual errors only (tone and positioning differences logged separately) | Sentiment: same prompt set. Accuracy: monthly audit sample, starting with pricing and feature claims | Sentiment collected daily, reviewed weekly; accuracy audited and reported monthly | Accuracy: 100% on pricing and core features. Sentiment: competitor set, per engine |
| 4. AI referral traffic | Sessions in the AI channel, and their share of all sessions; conversion rate by source reported separately | All sessions | Collected continuously, reported monthly | Your first full quarter; Similarweb’s category growth as external context |
| 5. AI-assisted pipeline | Value of opportunities created in the period with self-reported AI discovery or an AI referral as first touch, each counted once; share of all pipeline created | All opportunities created in the period | Reported quarterly | Your first quarter, with exclusions stated |
Record changes to the tool, collection method or calculation alongside the affected reporting period.
Supporting Metrics That Can Explain a KPI Drop
When a KPI changes, supporting GEO metrics help the team investigate whether placement, content coverage, or site access deserves attention.
- Average position in the answer: if visibility score holds but position slips, inspect the captured answers to see which brands appear ahead of yours and which sources support them.
- Prompt and fan-out coverage: fan-out is the set of sub-questions an engine searches behind one prompt. If citations fall while rankings hold, inspect the available retrieval and fan-out data for questions your content may not address.
- AI crawler activity in server logs: if crawler visits to key pages drop, check site access and robots rules before deciding that content changes are needed.
These checks help you explain a change. To keep the numbers consistent from one report to the next, each KPI also needs a clear owner.
Who Should Own and Report AEO KPIs?
Analytics maintains the definitions and reconciles the data. The AEO lead uses those results to explain what changed and recommend where the team should focus next, following the enterprise AEO team structure we recommend.
Product marketing keeps the accuracy fact sheet current, while RevOps maintains the attribution field and pipeline qualification rules. Analytics brings those inputs into the monthly report for the AEO lead, who presents results and recommendations to the CMO quarterly. The CMO carries one line into the board deck.
Our GEO strategist Tanya Desai explains how that reporting works in practice: “We report on visibility, SOV and sentiment movement as a whole, and per target topic cluster. We also report the citation share for each prompt, topic, and LLM, so the client can see the impact of each piece of content.”
Your 2027 AEO Strategy Starts With a Baseline
A useful AEO report connects where your brand appears and how AI describes it to the revenue that follows. These five KPIs give leadership that account: visibility reported engine by engine and benchmarked against competitors, pointing to AI-assisted pipeline read from more than one signal, with an owner outside SEO.
Start this quarter by confirming your prompt and competitor sets, documenting the calculation rules, collecting results, and assigning reporting responsibility. Those observations will give you a baseline for judging changes in 2027.
If you need help establishing that baseline and building a program that gets your brand found, cited and chosen by AI, talk to Foundation about AI visibility.
FAQ
What is a good visibility score?
No standard exists. Compare yourself with 3 to 5 competitors on the same prompts and engine, and track the 90-day trend.
How often should you measure AEO KPIs?
Collect visibility, citation, and sentiment data daily, review it weekly, and report it monthly. Audit accuracy and report traffic monthly. Report pipeline quarterly.
Are AEO KPIs different from GEO KPIs?
The metrics largely overlap. Both assess AI visibility and run alongside your SEO reporting.
Can GA4 track AI referral traffic?
Yes. GA4’s AI Assistant channel groups visits from sources like ChatGPT, Gemini and Copilot. Check where Perplexity and Claude visits land in your property, and add a custom channel group if they sit in Referral. Clicks from Google’s AI Overviews and AI Mode still appear as organic search.
Which tools track AEO KPIs?
Profound, Peec AI, Semrush AI Toolkit, HubSpot AEO, and Writesonic track visibility. Profound, Ahrefs Brand Radar, HubSpot AEO, and Peec AI report citations. GA4 and your CRM cover traffic and pipeline.
How do you measure AEO performance?
You measure AEO performance with five KPIs: visibility score, citation share by engine, sentiment and accuracy, AI referral traffic, and AI-assisted pipeline. Report answer-based metrics by engine, and count AI-assisted pipeline only from opportunities with documented AI discovery, keeping branded search as context.

